Summary Statistics Report
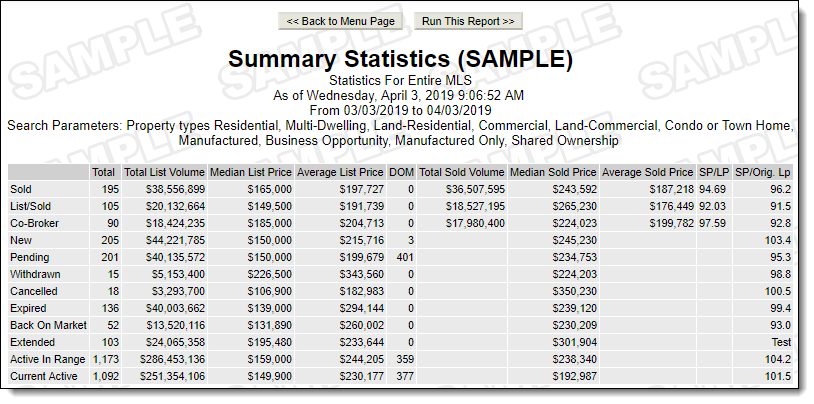
The Summary Statistics report shows summary statistics for sales, including breakdowns for co-listings and listings/sales, and stats for new, expired, and other statuses during the time period specified.
To run the report, click Summary Statistics on the Inventory and Production Reports page. Select criteria based on the Report Generation template and click Next to continue.
Note
This template can be edited only by the MLS administrator.
Select an office or member from the list and click Use this Member to display the report.

Notes about this report:
The average is the total value divided by the number of listings. The median is the middle value, such that half the values are larger, and half the values are smaller.
The SP/LP and SP/OLP columns show the ratio for the sale price to list price and sale price to original list price. For example, a listing whose original list price was $200,000, but had a price reduction to $195,000 before selling at $193,000 would have an SP/LP ratio of 98.97 and an SP/OLP ratio of 96.5.
The Active in Range row shows listings that were active at any time between the begin date and the end date of the report. For example, if a listing closed on the first day of the date range, it would still be counted as active in range.