Market Summary Report
The Market Summary report shows the state of your market for a set time period. To run the report, click Market Summary under Statistics on the menu.
At the top of the report, graphs illustrate trends in the Number of Listings, Listing Prices, Absorption Rate, Sold to List Ratio, Days on Market, and Price Volume. The tables at the bottom of the report contain more detailed numbers that support the graphs at the top.
To change the parameters of a report, including date, property type, and location, click Customize and select New Location.

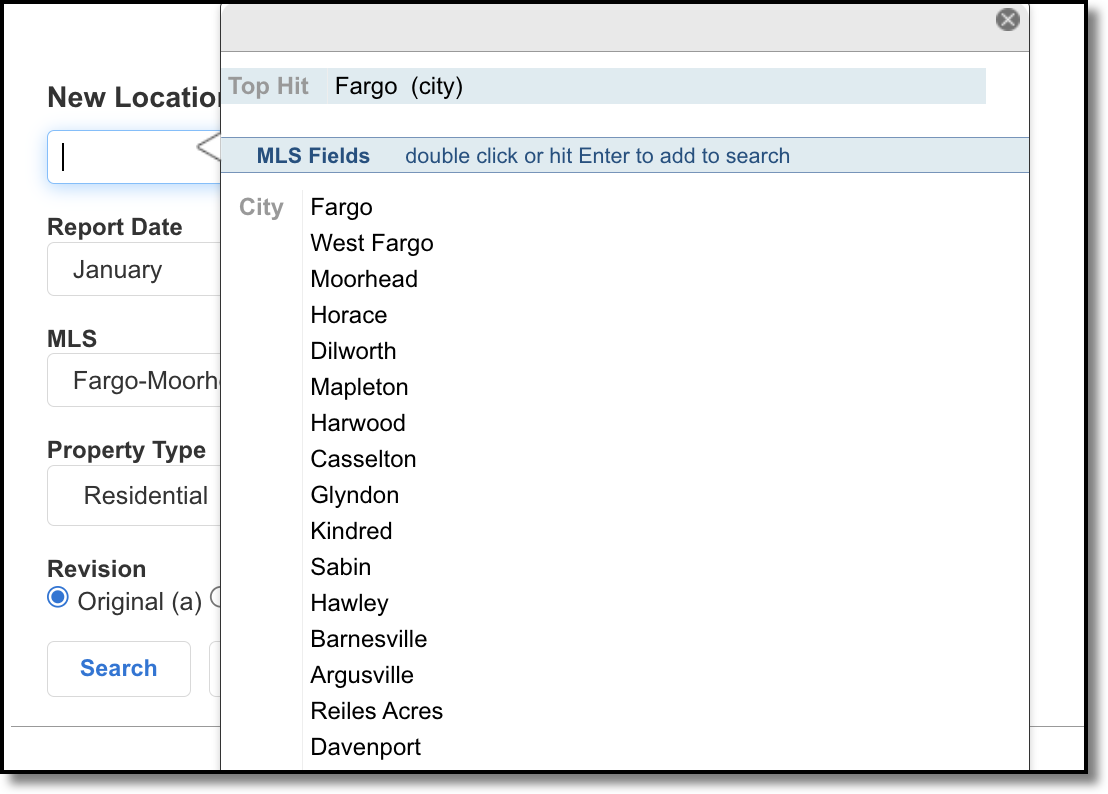
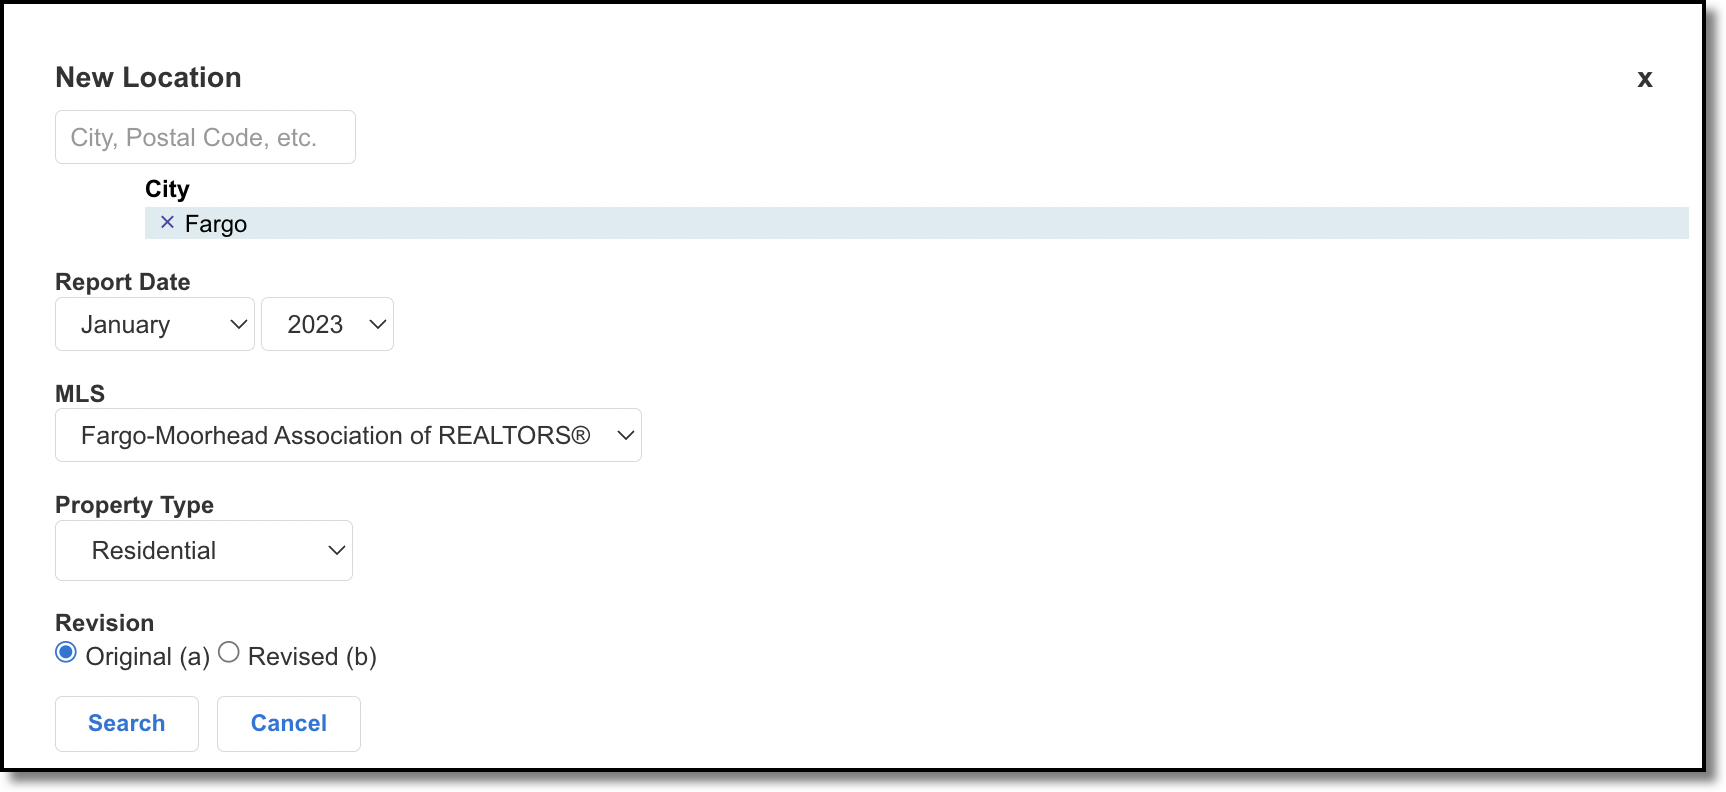
Set a month and year for the report and select a property type. In the Location field, enter a city, county, postal code, or other location. Double-click your selection or press Enter. Click Search to generate the report with the new criteria.
Click Previous Locations in the Customize dropdown list to see the last 10 market searches for the currently logged in user. Click the star icon next to a search to mark it as a favorite and save it for future use.
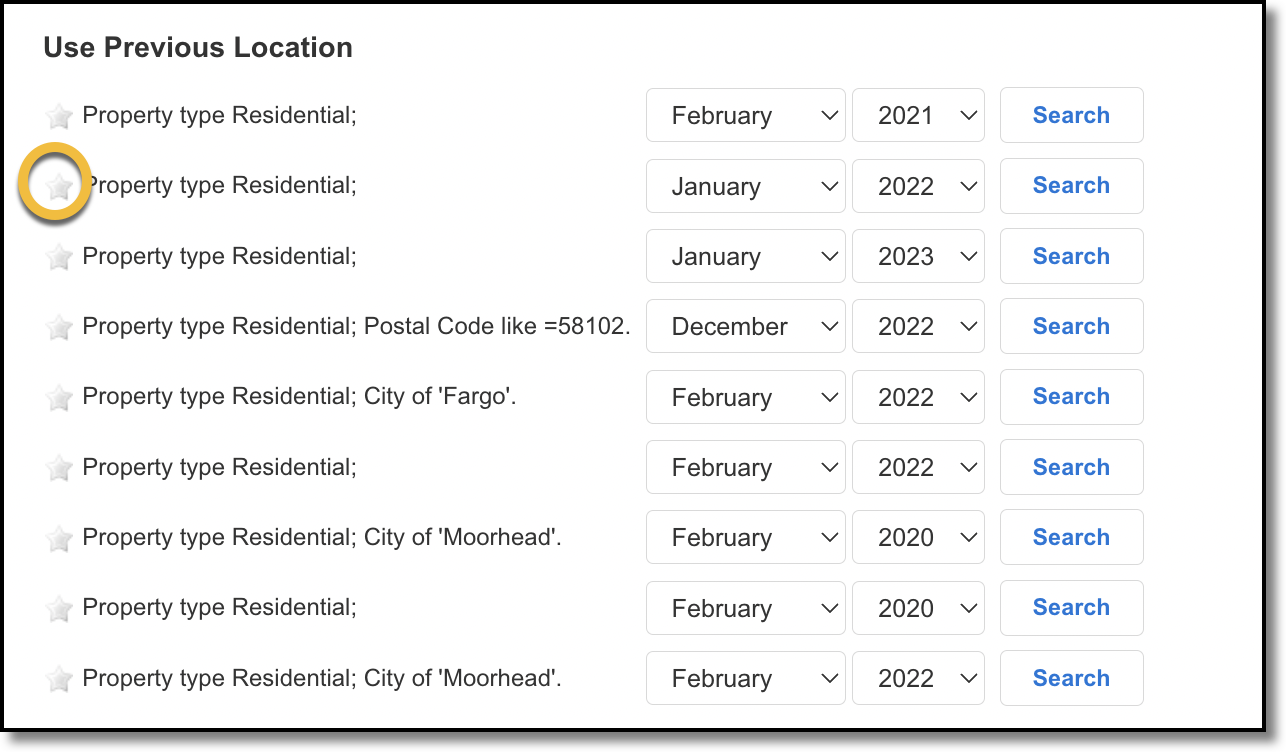
Marking a search as a favorite will move that search to Favorite Locations in the Customize dropdown list, where you can access it for future use.

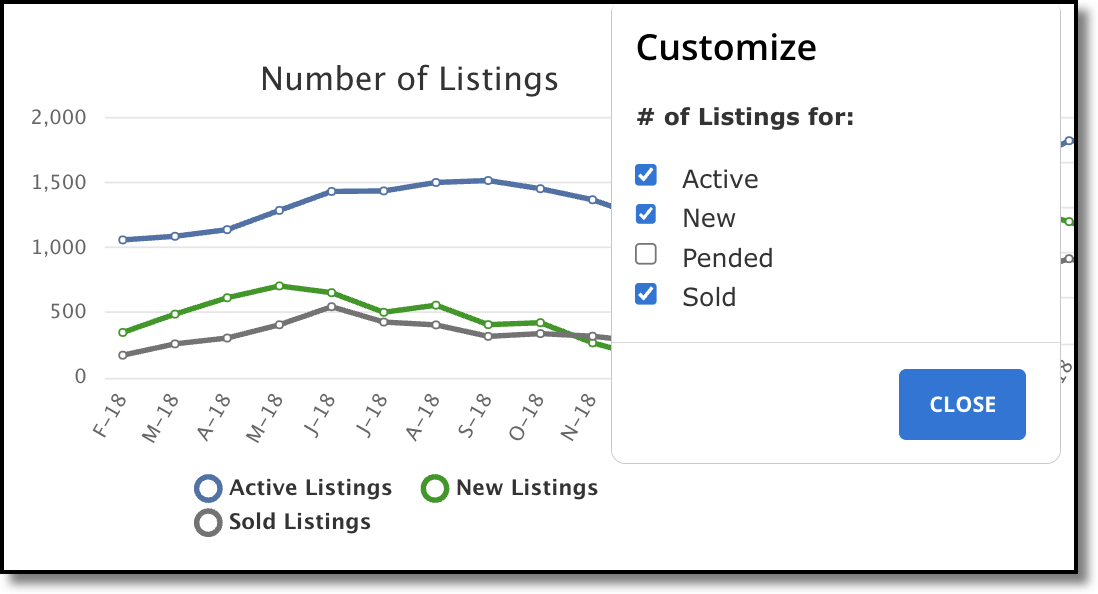
You also can customize the lines that appear on Listing Charts. Click the wrench icon in the upper right corner of a chart to customize the data that appears.
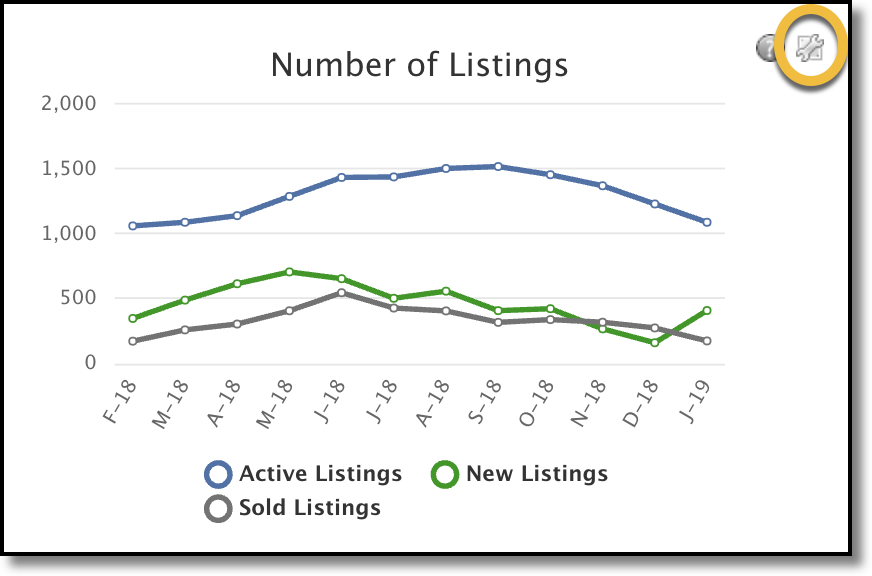
Customization options depend on the chart. For example, in the Number of Listings chart, you can select which listing statuses to display.
To email a link to the report, click the Email button.

Select or type a recipient's name, and select one of the following options for how you want your email to be sent:
Use Flexmls (email will be sent via Flexmls)
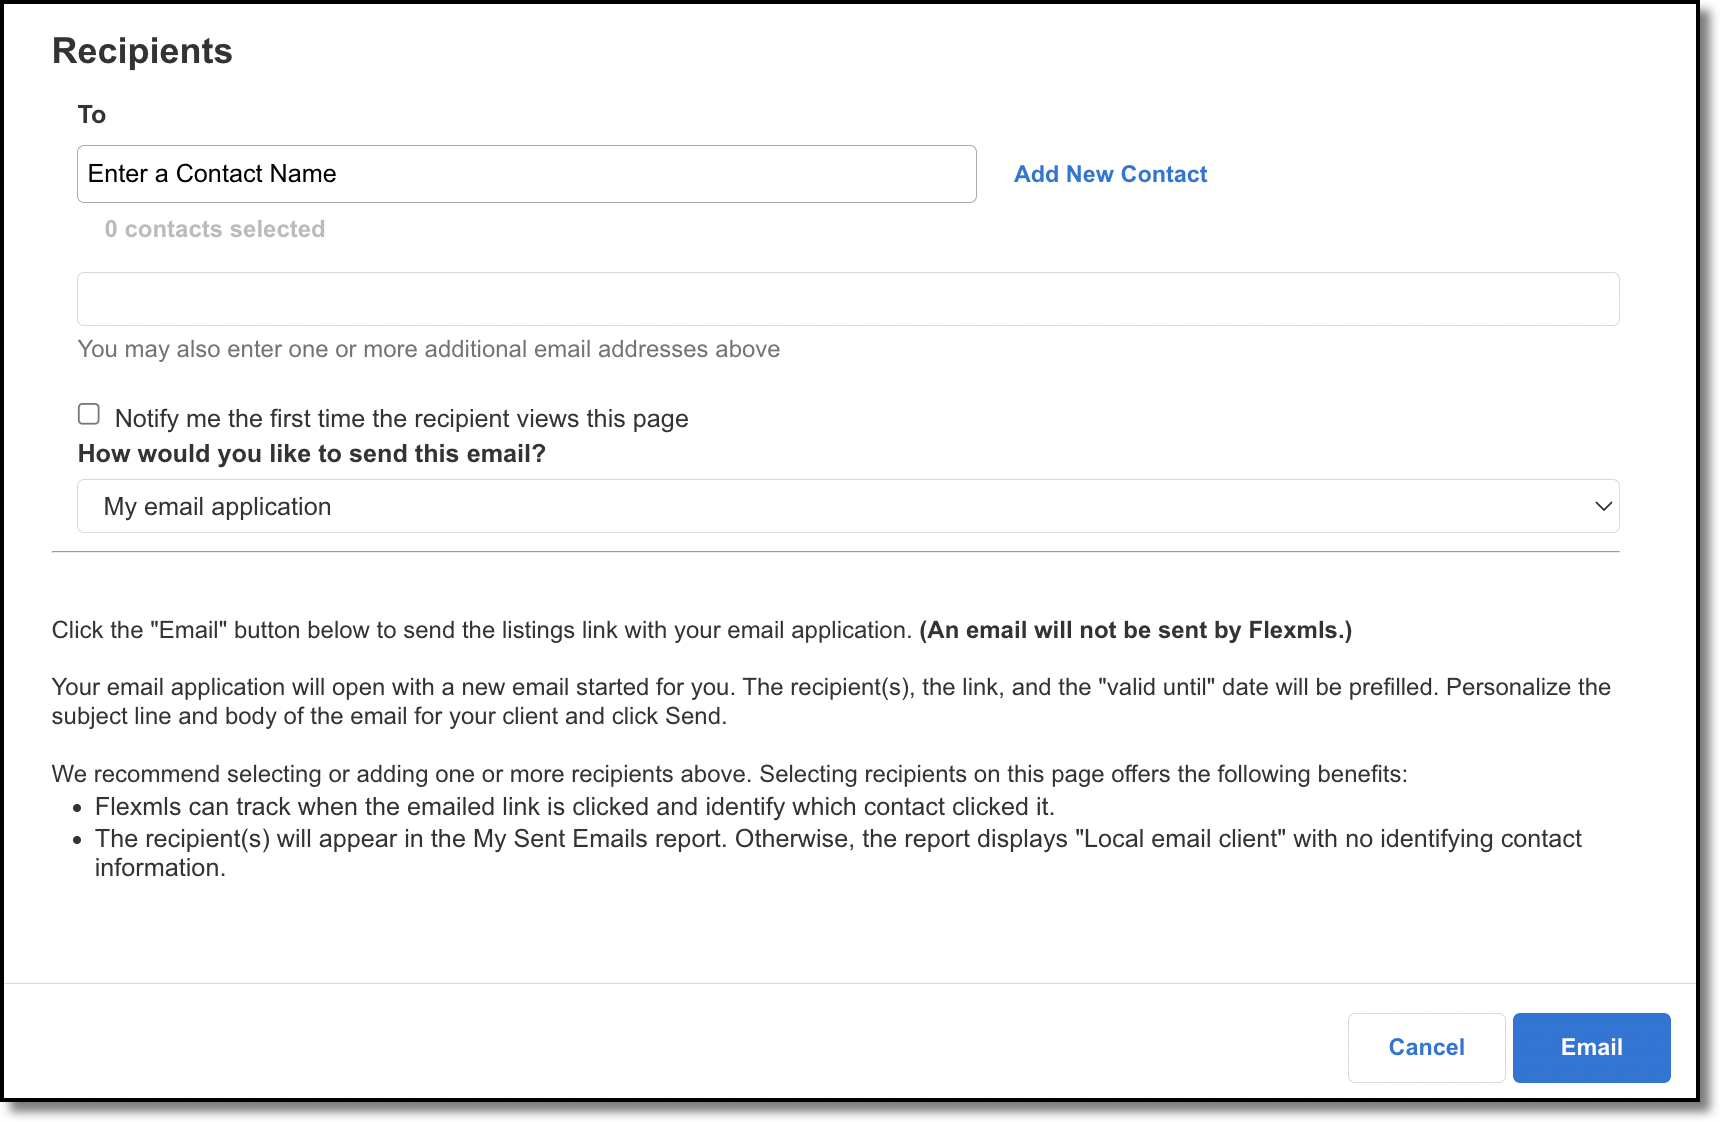
My email application (email will be sent via the email application you use)
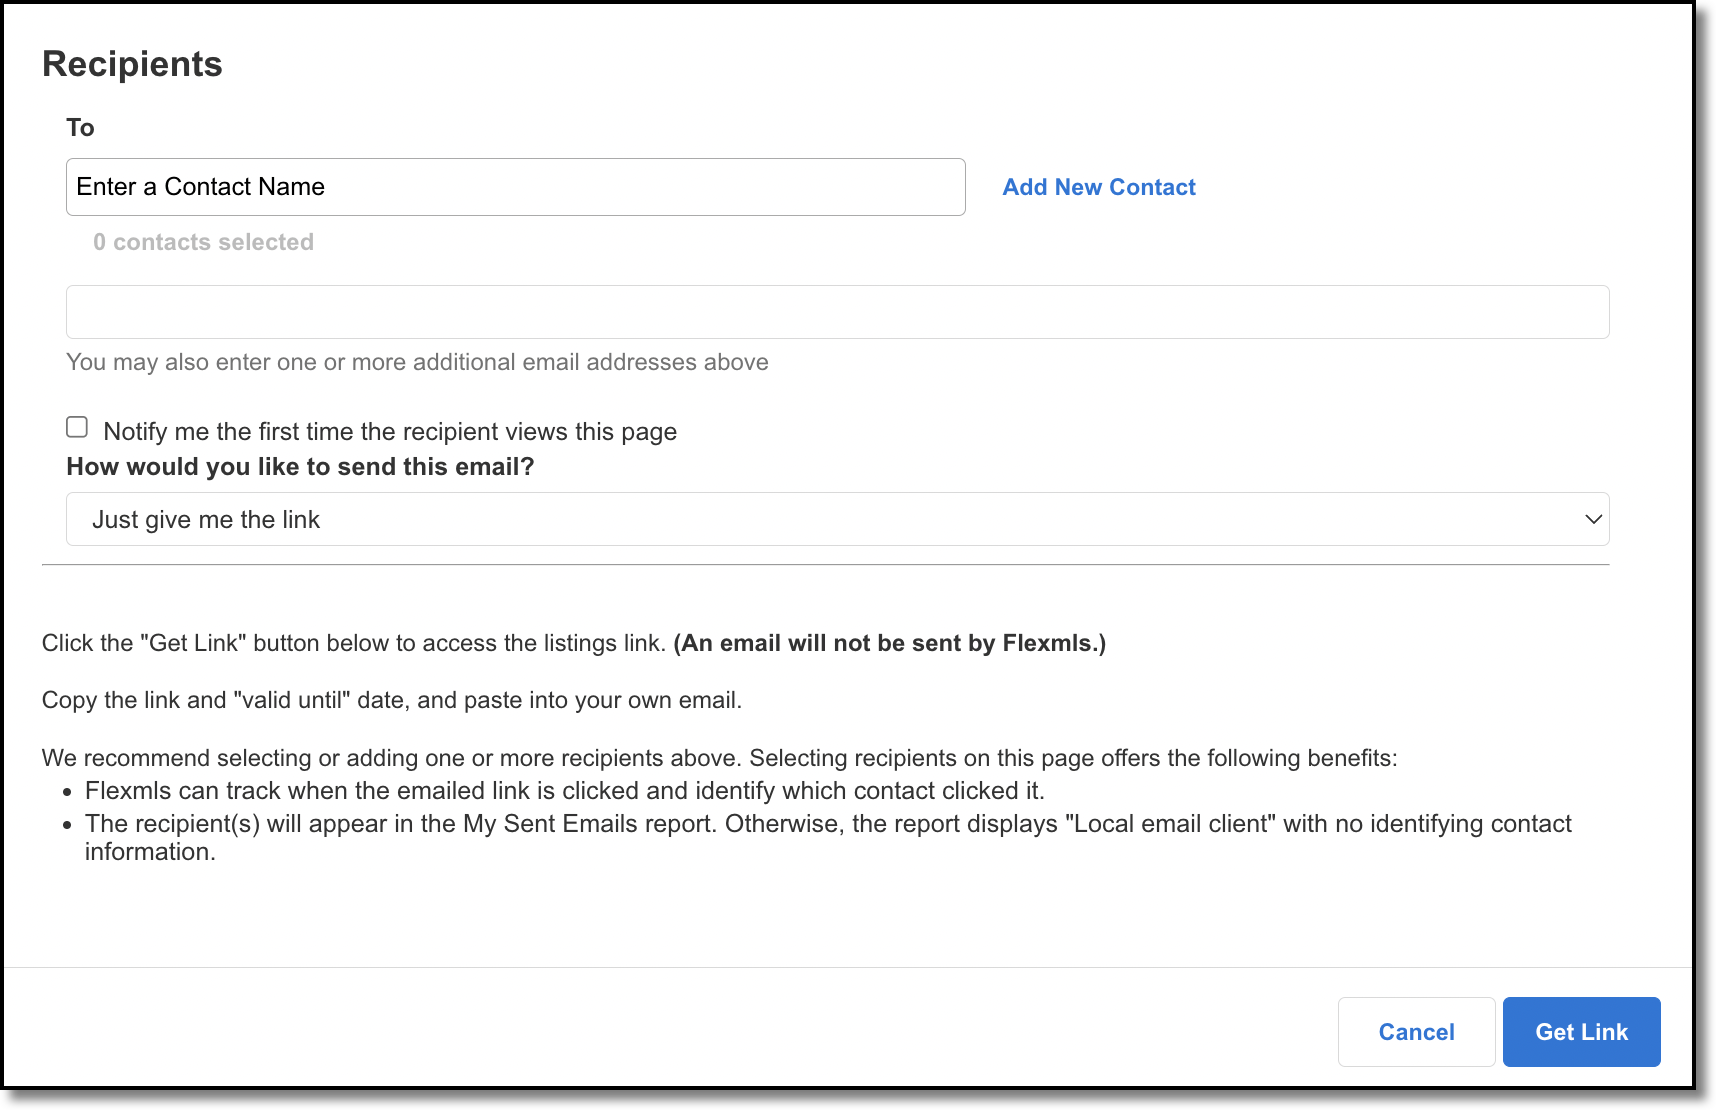
Just give me the link (generates a link that you can then send to recipients)

Next, select whether you want a copy of the email sent to you, and select whether you want to be notified when the recipient first opens your email.
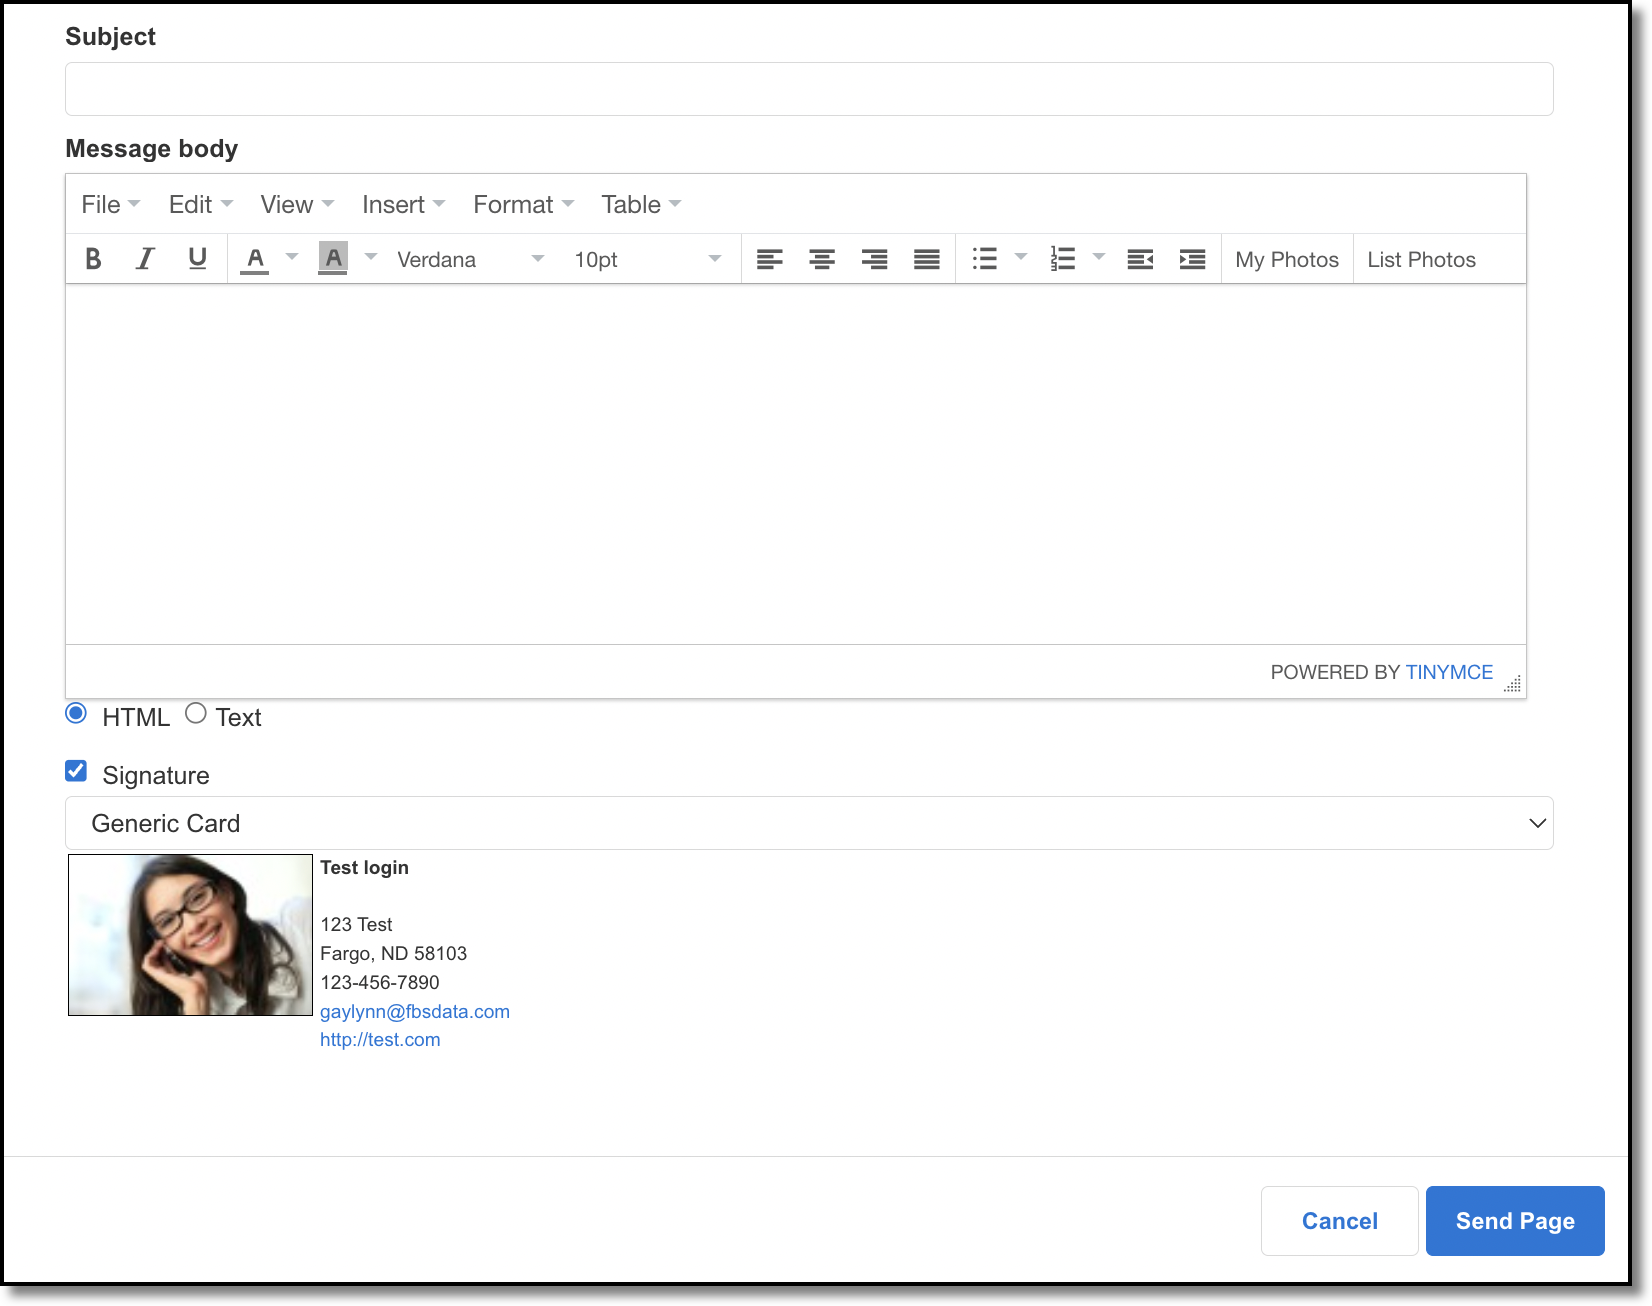
If you have opted to send the email using Flexmls, enter the subject line and compose the message of the email. You can select whether you want to use an email signature, and select the email signature you want to use in the dropdown. Once you have finished composing the email, click Send Page.
If you have opted to send the email using your email application, click Email to open your email application. You can then compose and send your email via your email application.
If you have opted to get a link, click Get Link. Once the link has been generated, click Copy To Clipboard so you can paste the link into your email.
Click Print to open the report in a printer-friendly format in a new window. A printer dialog box will also open, where you can select the printer and settings to print the report.
To export the data from the page to a CSV file (to be opened in a spreadsheet program such as Excel or Numbers), click Export. In the dropdown, select one of the following options:
Export data displayed on page - exports only the data that appears in the graphs
Export all downloaded data - export all data that is available to the graphs
For example, if you have chosen to display only active and sold listings on the Number of Listings graph, Export data displayed on page would export only that data, while Export all downloaded data would also include new and pended listings.
The following explains how the numbers are calculated in the Market Summary Report:
Active listings: How many listings were for sale during each month. The number of active listings is a "snapshot" of active listings on the 15th of the month. Rather than showing the number of all listings that were active at any time during the month, this chart displays a representation of the number of listings that were active on one day. However, the number of actives is not static and depends on when the report is run. A trend upward or downward from month to month can be established by using the same day of every month.
New listings: How many properties were put on the market during each month. It is the total number of listings newly added to the MLS system during the month. (All listings whose Listing Contract Date falls within that particular month.)
Sold listings: The total number of listings whose sales contracts were completed, or closed, during the month.