Sold Market Analysis Report
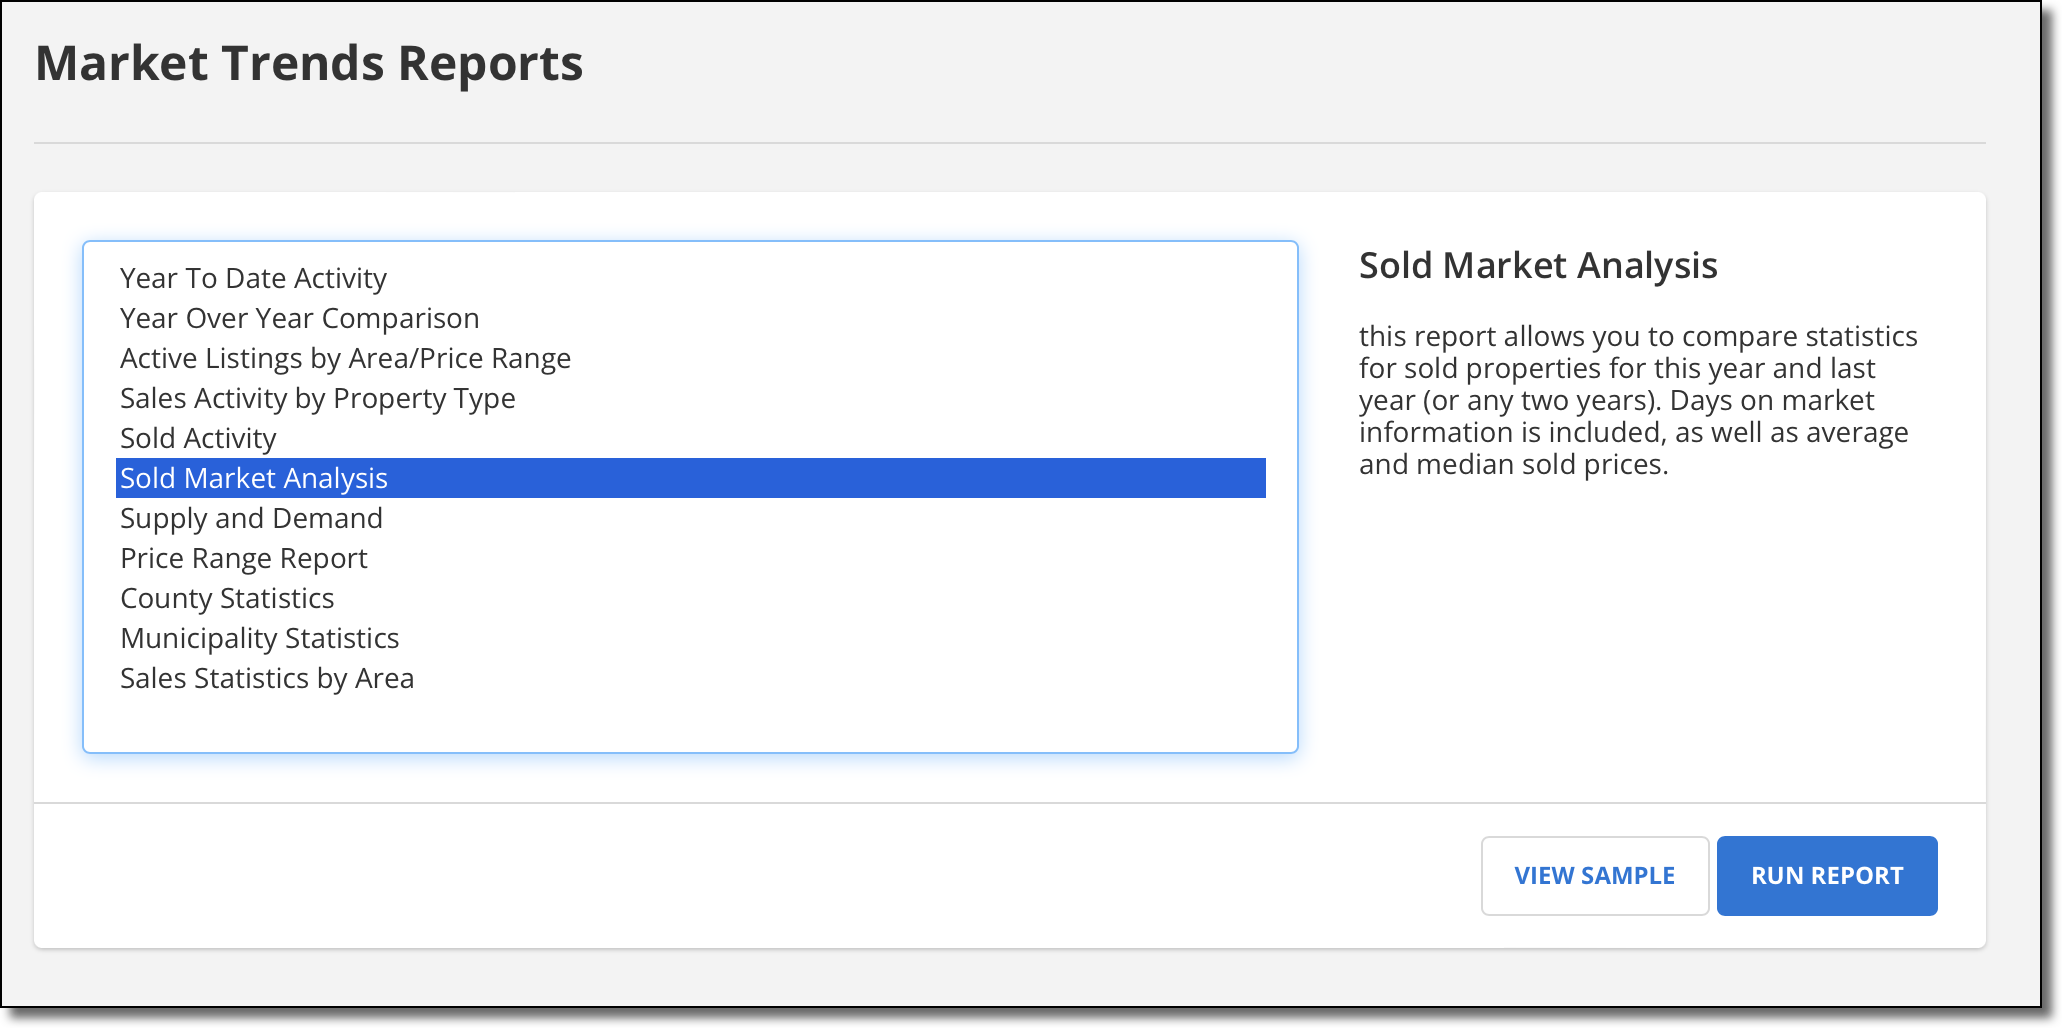
The Sold Market Analysis report allows you to compare statistics for sold properties from two consecutive years. Days on market information is included, as well as average and median sold prices.
To run the report, click Sold Market Analysis on the Market Trends Reports page.

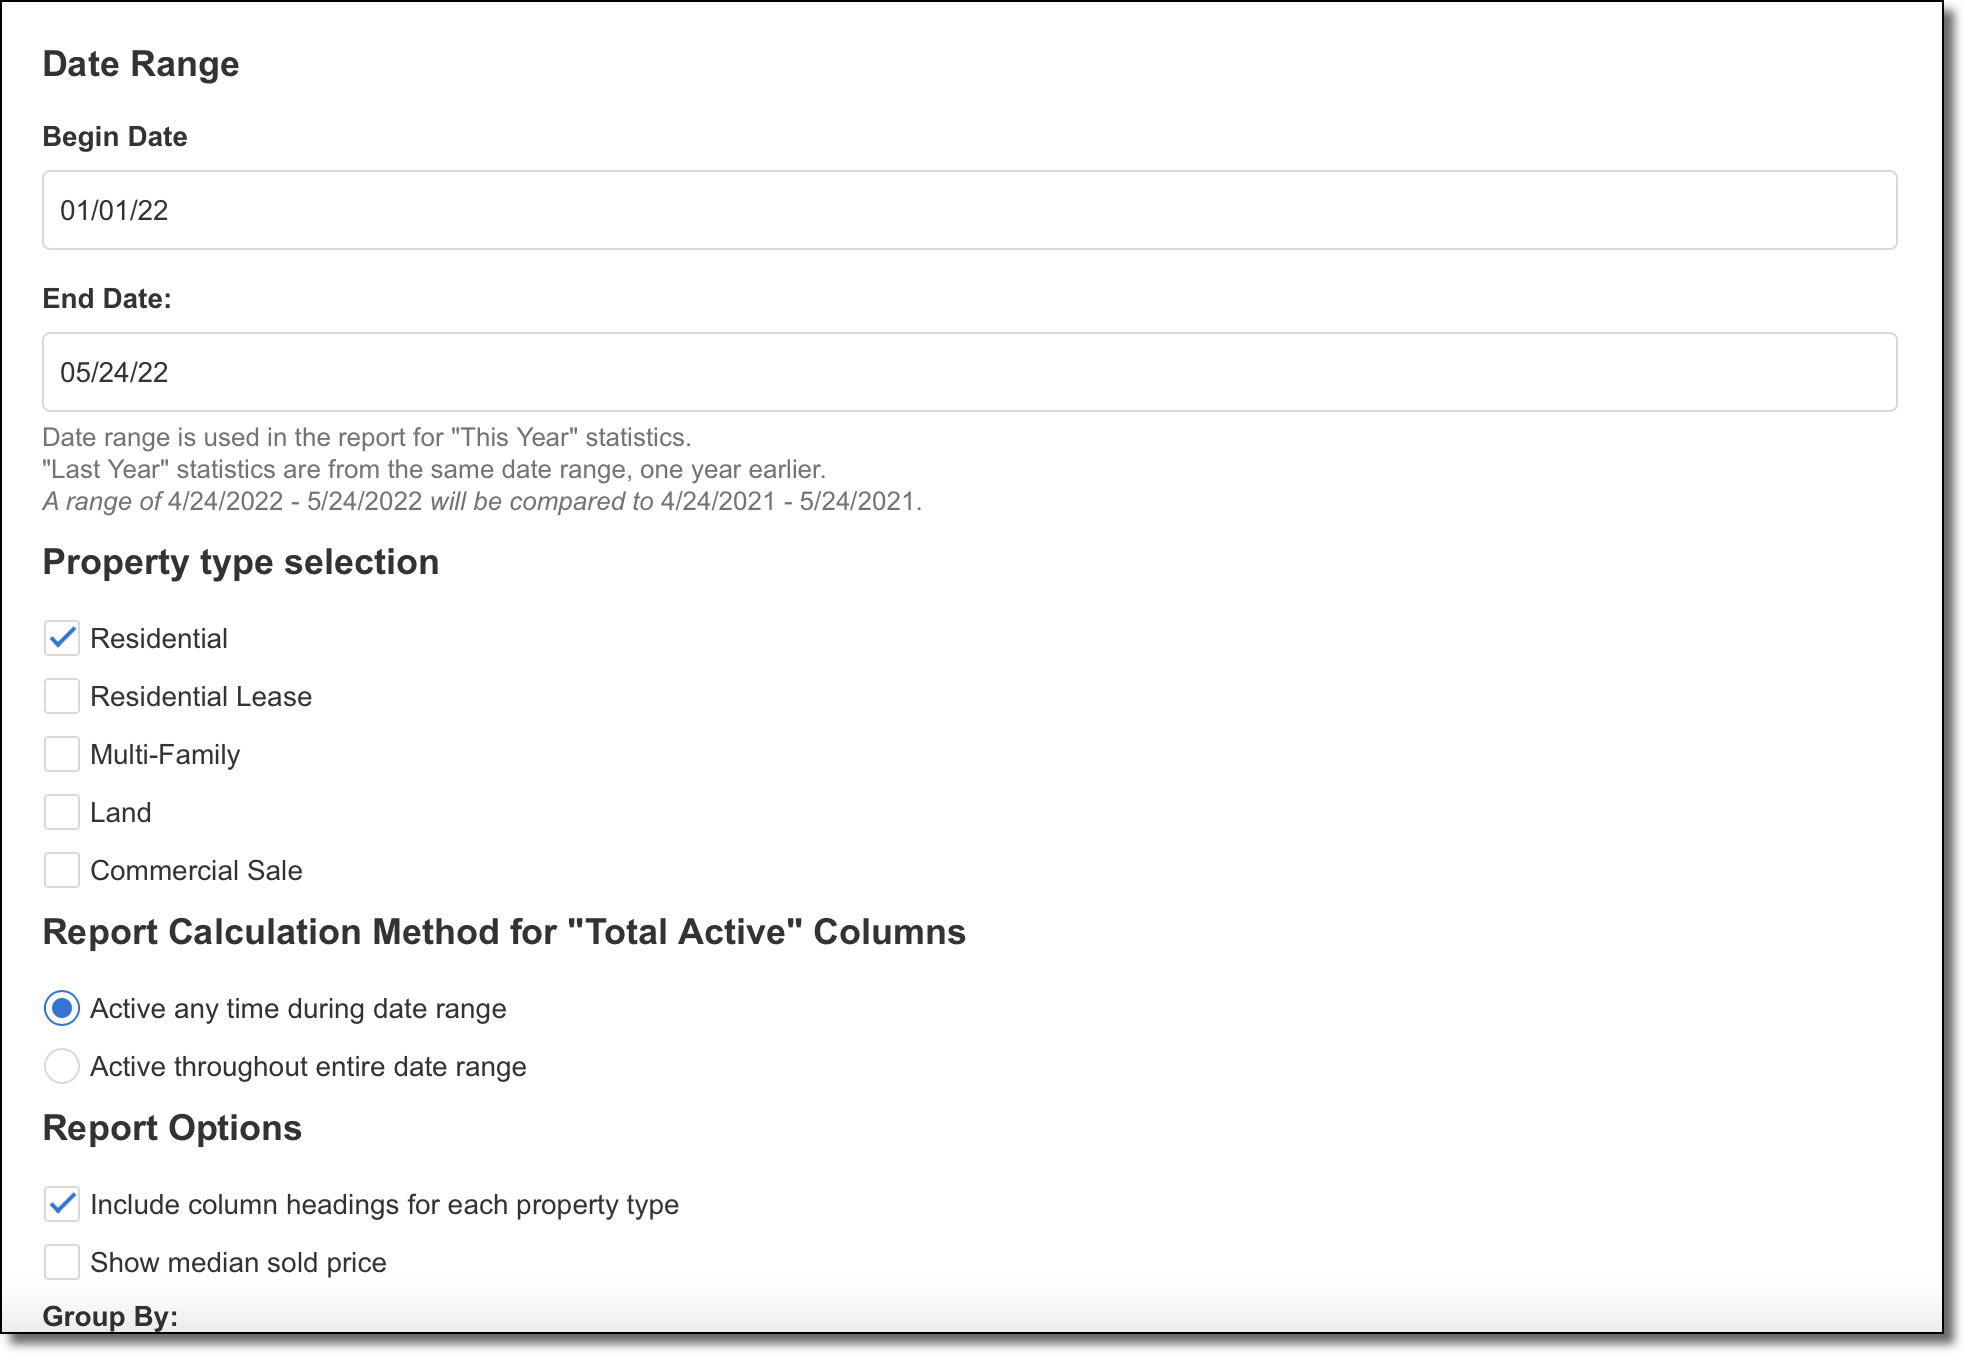
Enter the date range for "This Year" statistics. "Last Year" statistics will use the same date range, but one year earlier. Then choose the property types that you want to include in the report. Choose the method of calculation you want to use for the "Total Active" column.
Select Active any time during the date range to include all listings that were active at any point during the selected time frame, regardless of the current status.

Define other report options, such as whether to include column headings for each property type. Select the field to use to group the data. You can also filter the report using a Quick Search template. Click Next to generate the report.

If your MLS calculates DOM from begin date to under contract date, the Days on Market column will reflect this. The Days to Close column will show the number of days between the begin date and the sold date. If your MLS uses ADOM, the DOM column will change to an ADOM column instead.
Note
When printing the Sold Market Analysis report, change the Page Setup to Landscape mode to ensure that all columns fit on the page.