Supply and Demand Report
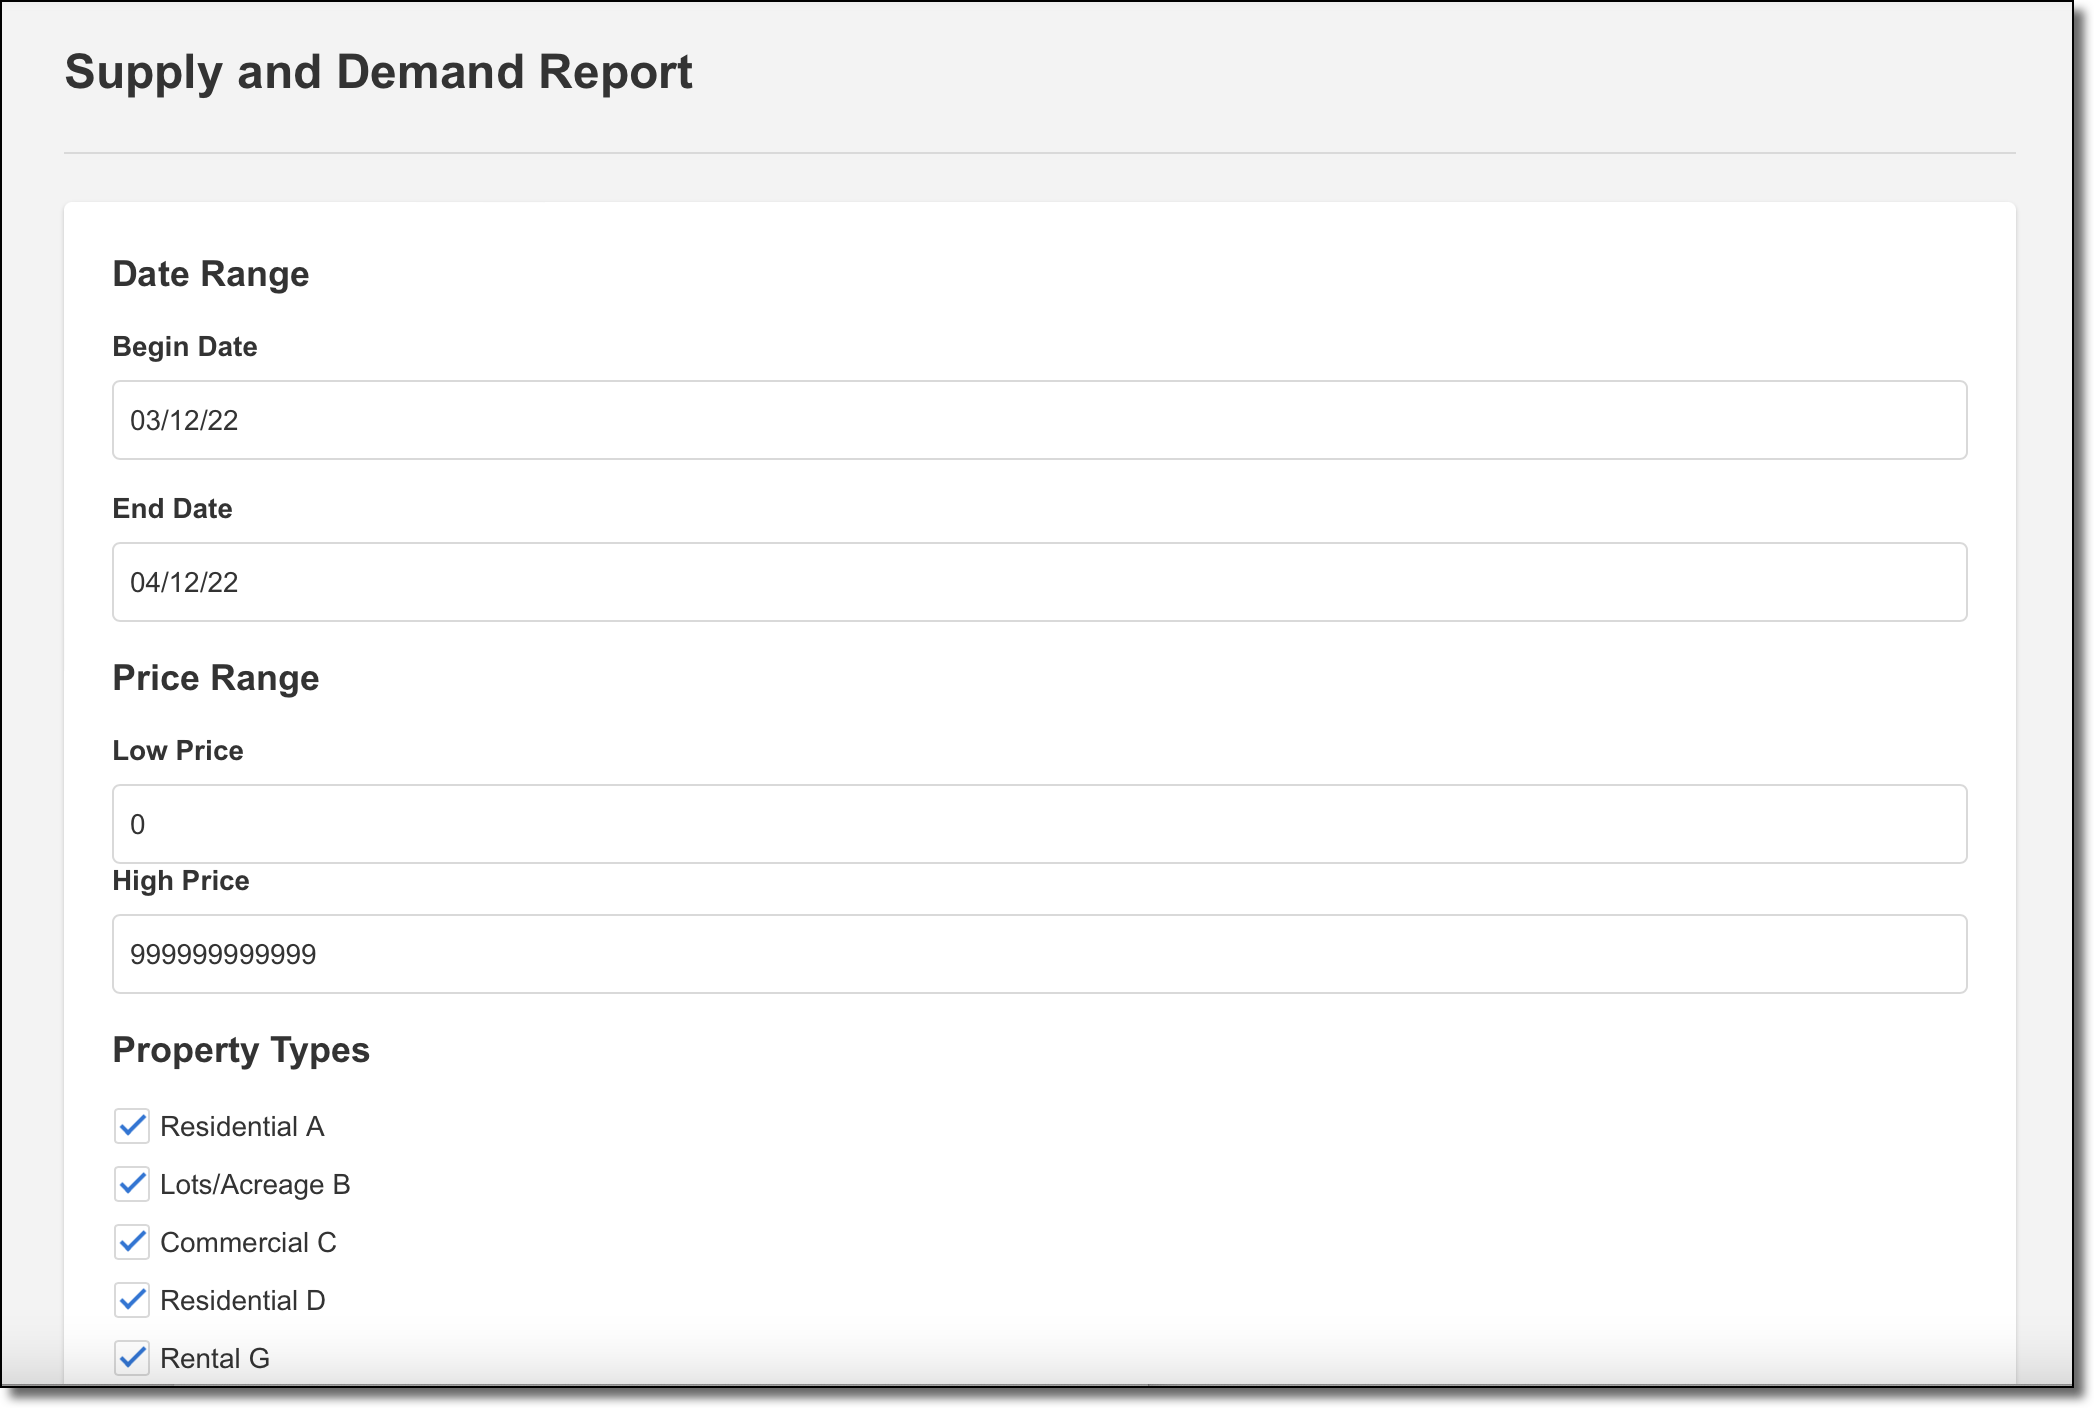
The Supply and Demand report shows the amount of supply (how many listings are active) versus the amount of demand (how many listings are sold). To run the report, click Supply and Demand on the Market Trends Reports page.
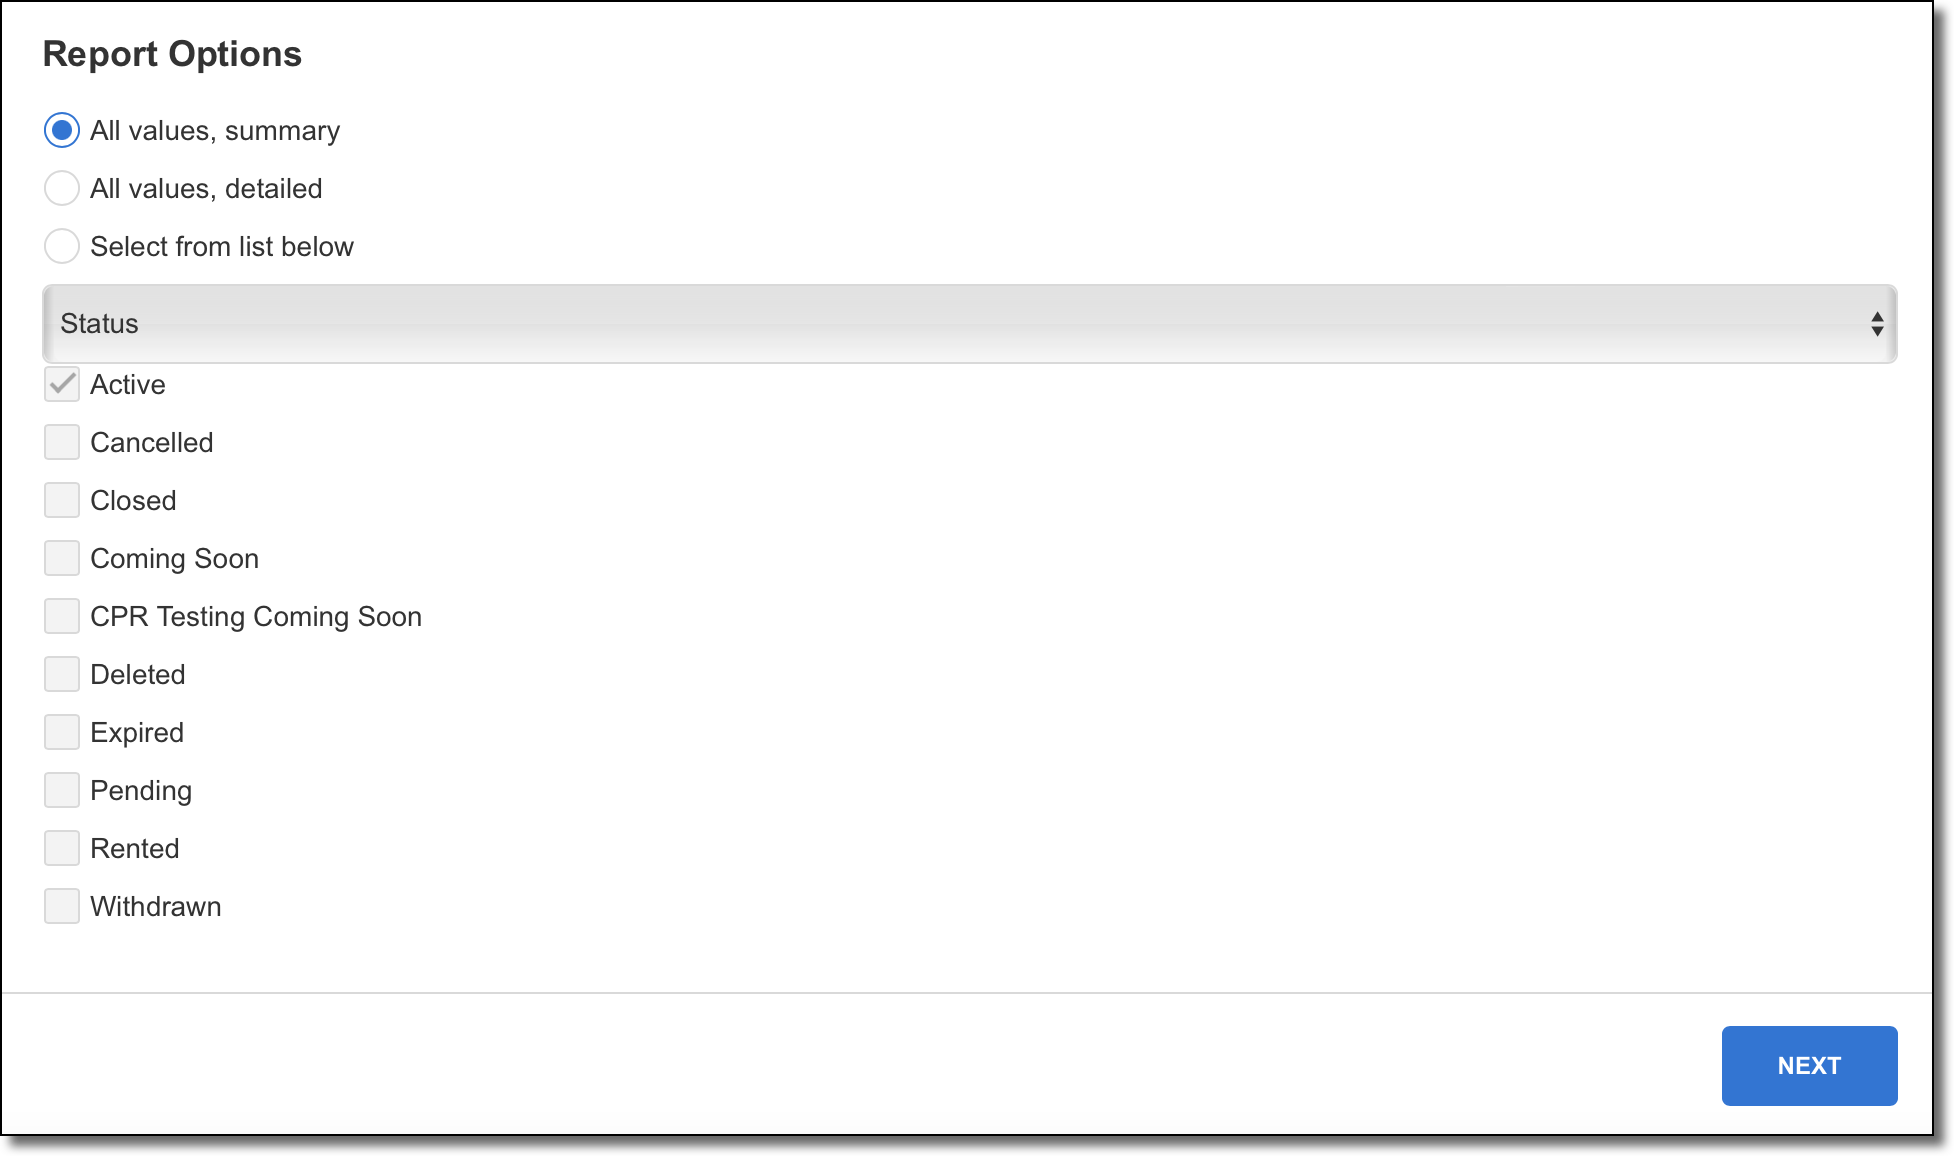
Enter a date range and price range for the report. Choose the property types to include in the report. From the drop-down list under the Report Options heading, select a field to use to limit and group the data. Select one of the following report options:
All values, summary – Show statistics for all values in the list. For example, if you selected County from the drop-down list, show a summary for all counties.
All values, detailed – Show statistics for all values in the list and group by each option. For example, if you selected County from the drop-down list, show statistics for all counties, broken down by county.
Select from list below – Select the values from the field to include. For example, if you selected County from the drop-down list, you can select which counties to show data for.


Click Next to generate the report.
