Stats Tab (Search Results)
When you are viewing search results, the Stats tab displays statistical data for all the listings in the current search, regardless of status, price, or other data fields. You can also view the average, median, low and high values for original price, list price, sale price, DOM, price change, and percent price change.
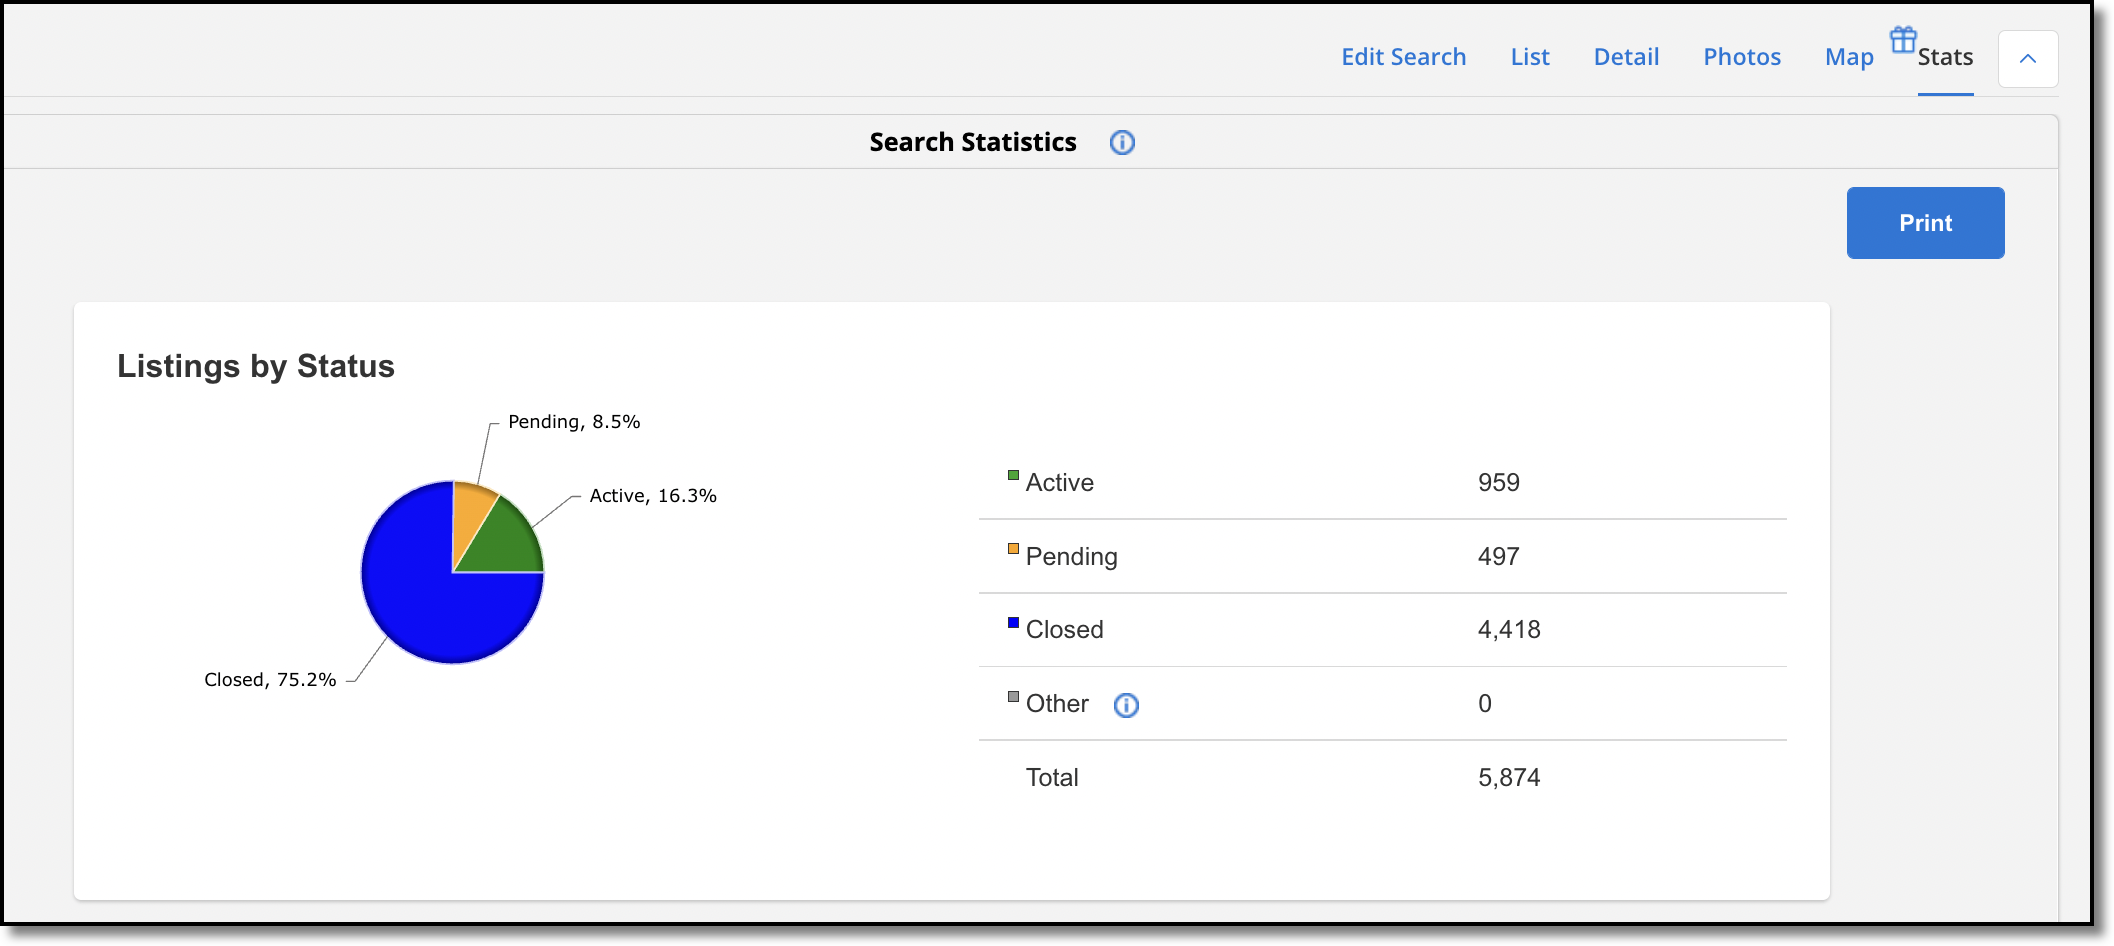
To print the data, click the Print button in the upper right corner of the Search Results Statistics report.
The Stats tab is divided into the sections listed below. Below the table of data in each section, a pie chart displays the data visually. The legend shows which information the chart colors correspond to. As you select different listings, the pie charts will adjust to display the currently selected listing(s).
Listings by Status - The Listings by Status section categorizes the search results by listing status. Active, Pending and Sold statuses are listed individually. Other statuses are combined into an "Other" category.
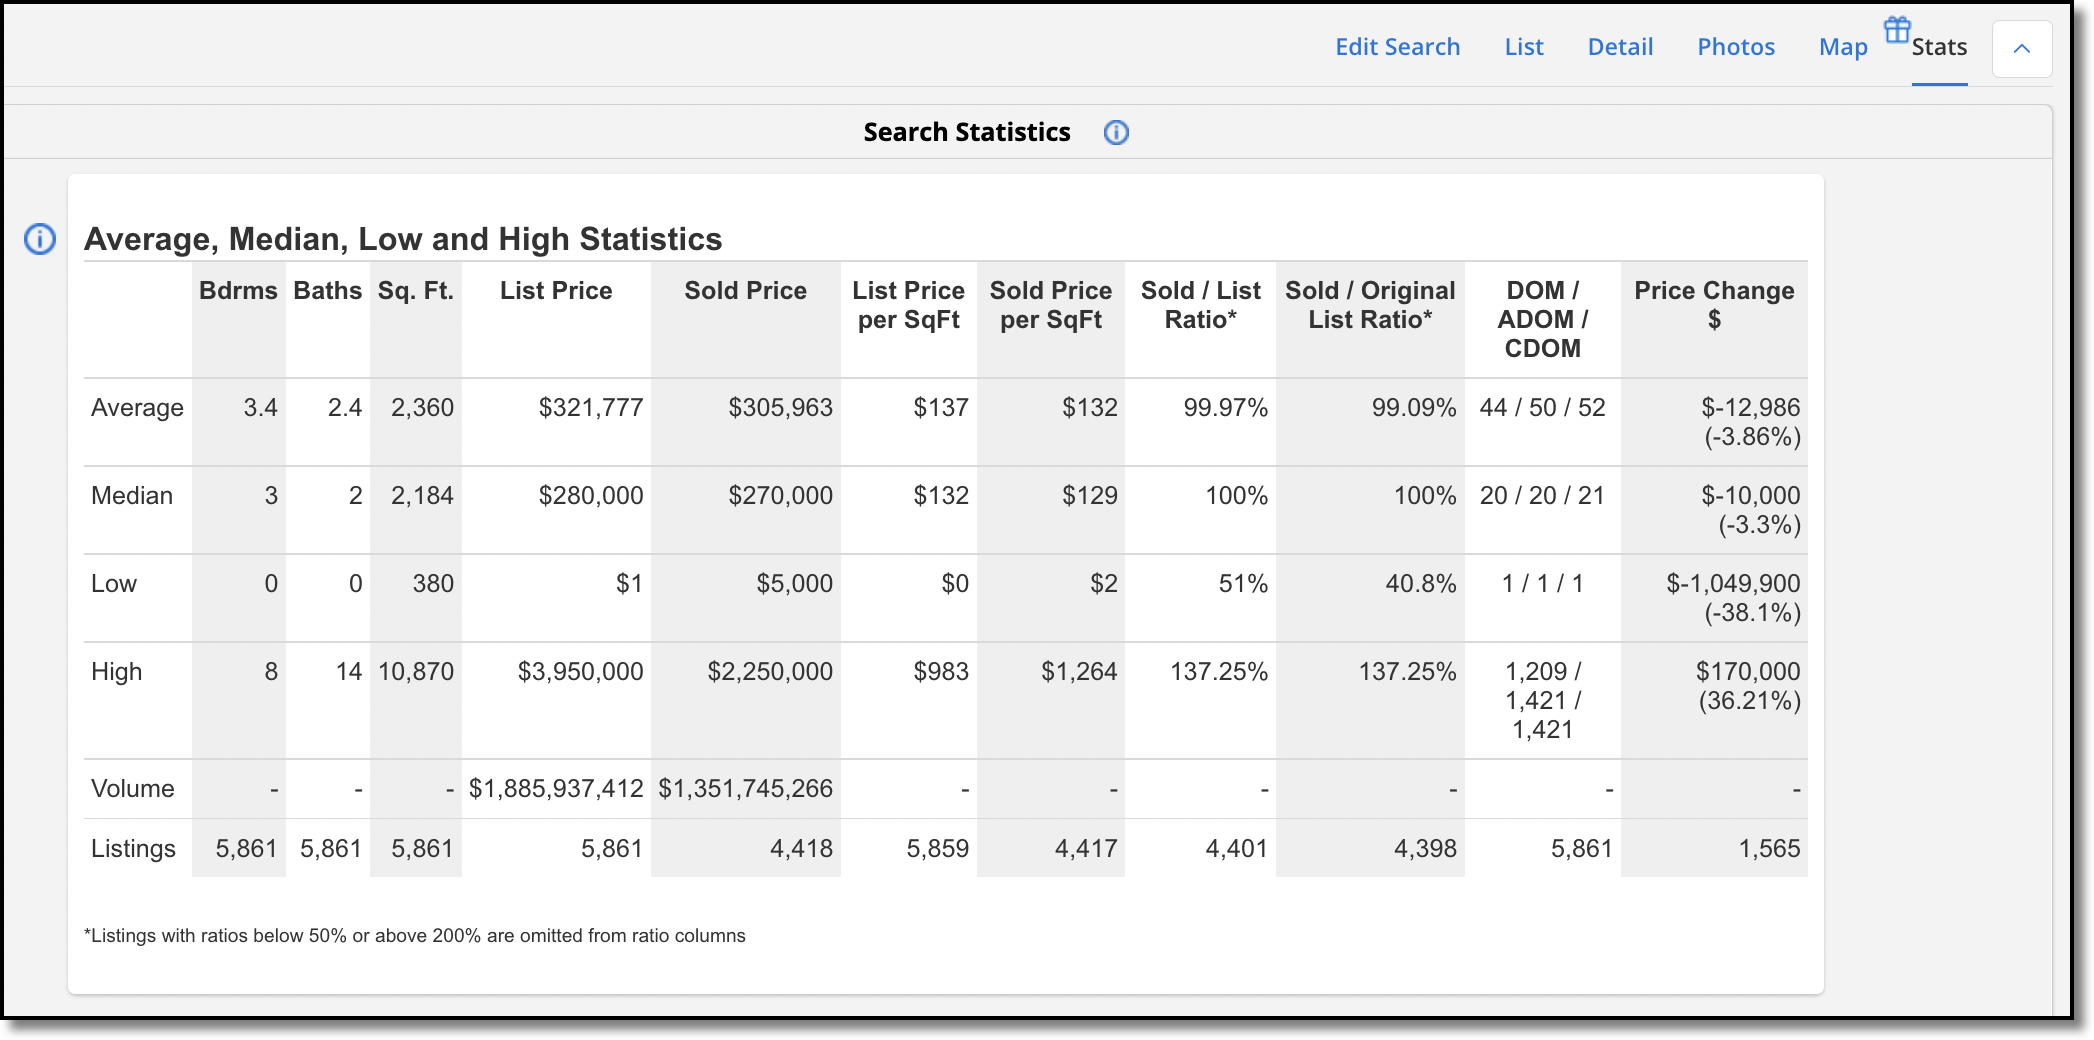
Average, Median, Low and High Statistics - The Average, Median, Low and High Statistics section displays statistics for common listing fields such as bedrooms, bathrooms, square footage, list price, and sold price. It also includes some calculated statistics such as the Sold Price to List Price Ratio.The numbers in the bottom row of the table show how many of the listings from the current search results are included in the statistics for each column. A listing will not be included if it does not contain relevant data for that column. For example, if your MLS does not require square footage to be entered, listings that do not include square footage will not be included in the square footage statistics.
Note
Note: The DOM/ADOM/CDOM portions in these stats are only for listings whose DOM has stopped calculating, i.e., listings that are off-market.
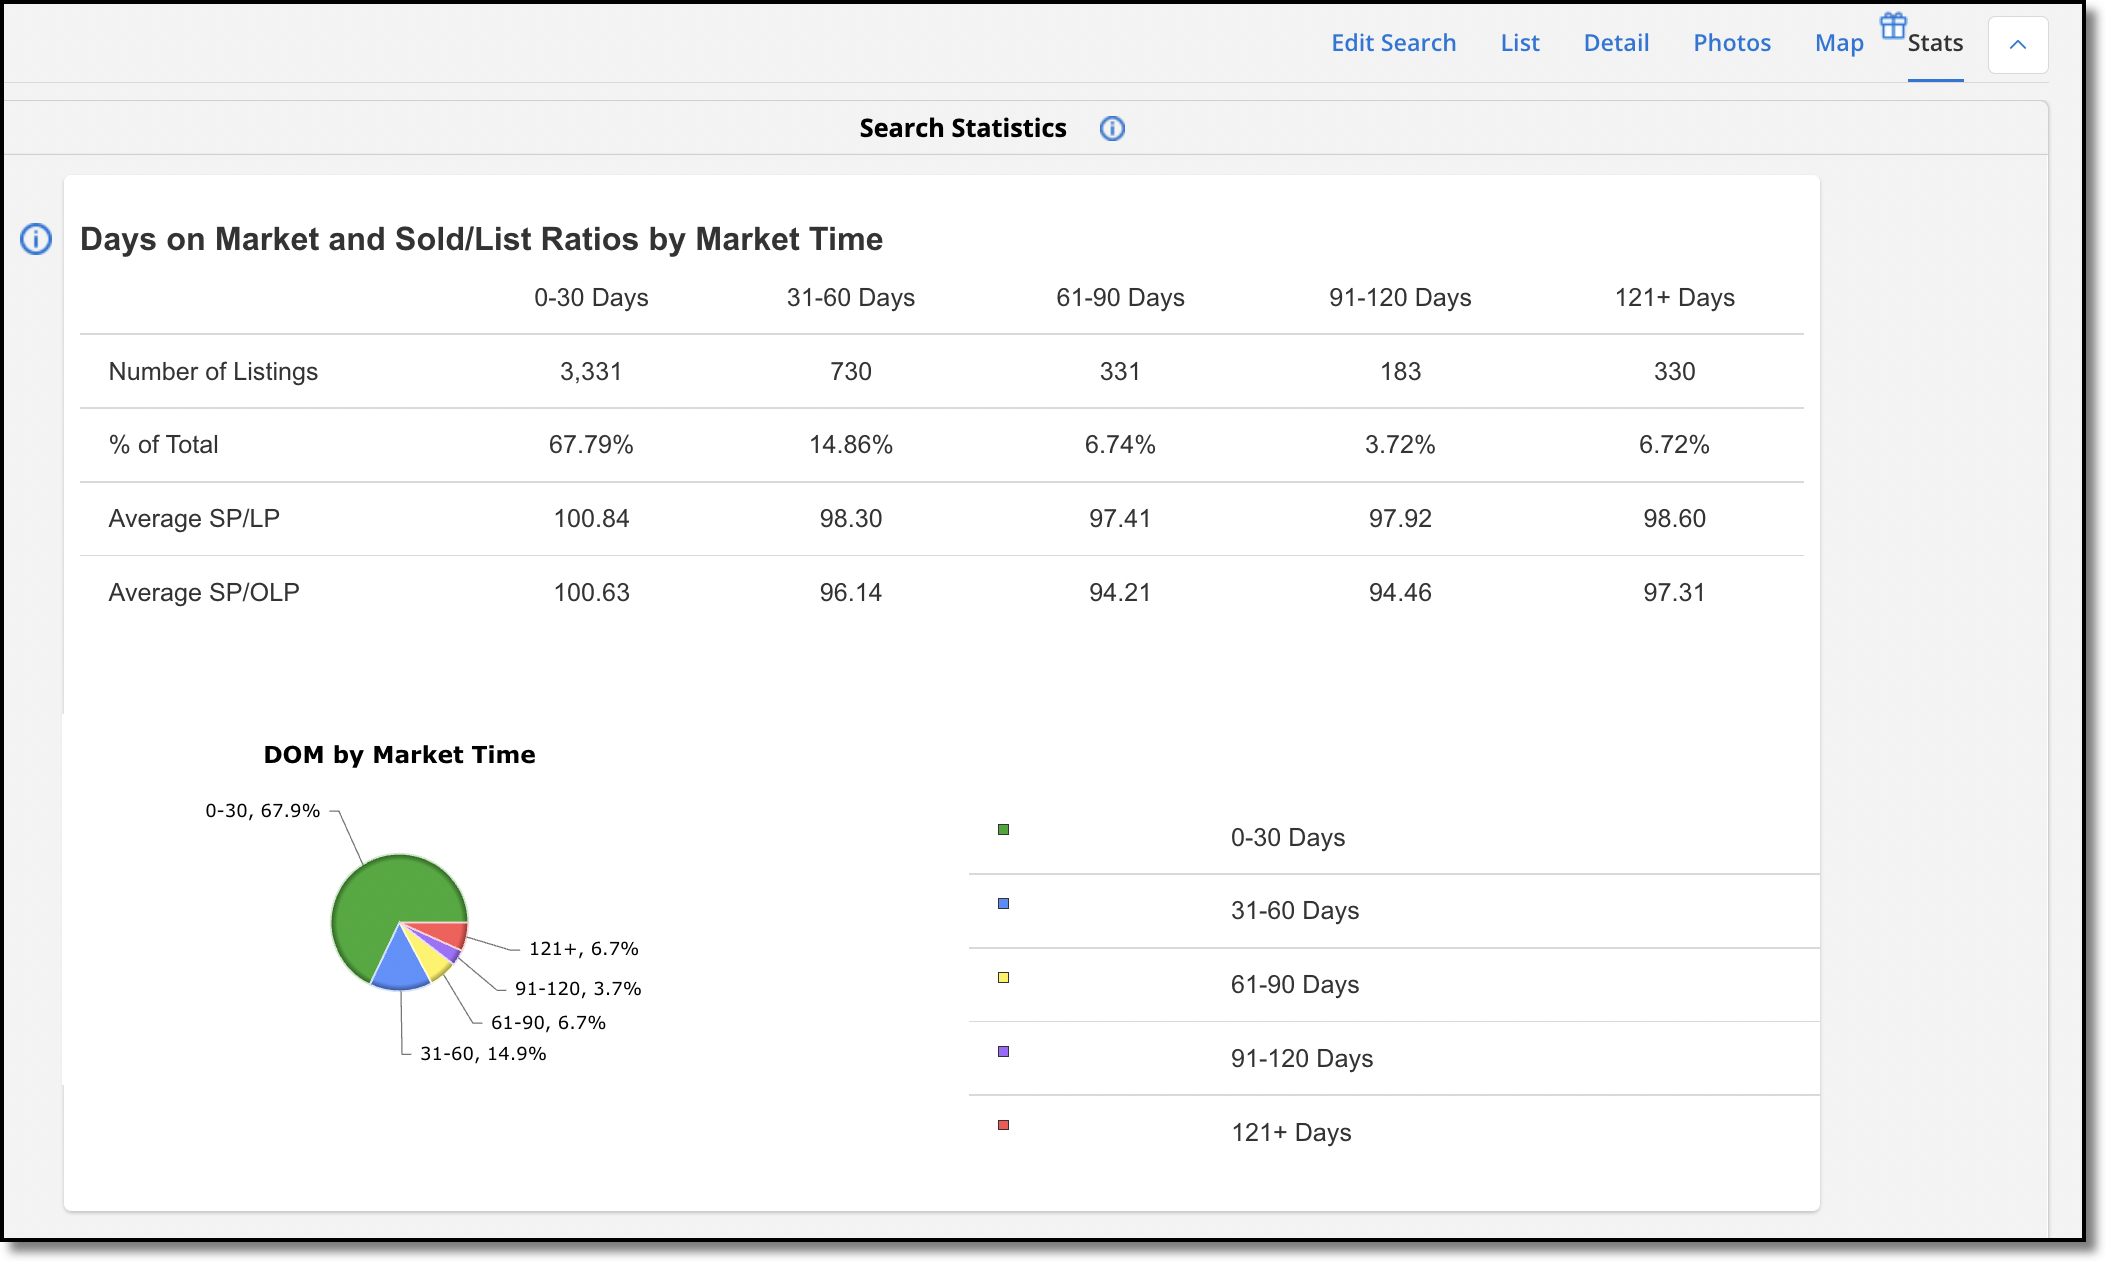
Days on Market and Sold/List Ratios by Market Time - The Days on Market section shows price ratios based on days on market. The Number of Listings row categorizes listings from the search results into market time segments (0 to 30 days, 31 to 60 days, etc.). The % of Total row shows the percentage of listings from the current search results in each market time segment. The Average SP/LP row shows the average Sold to List Price ratio for each time segment. The Average SP/OLP shows the average Sold to Original List Price ratio for each time segment.
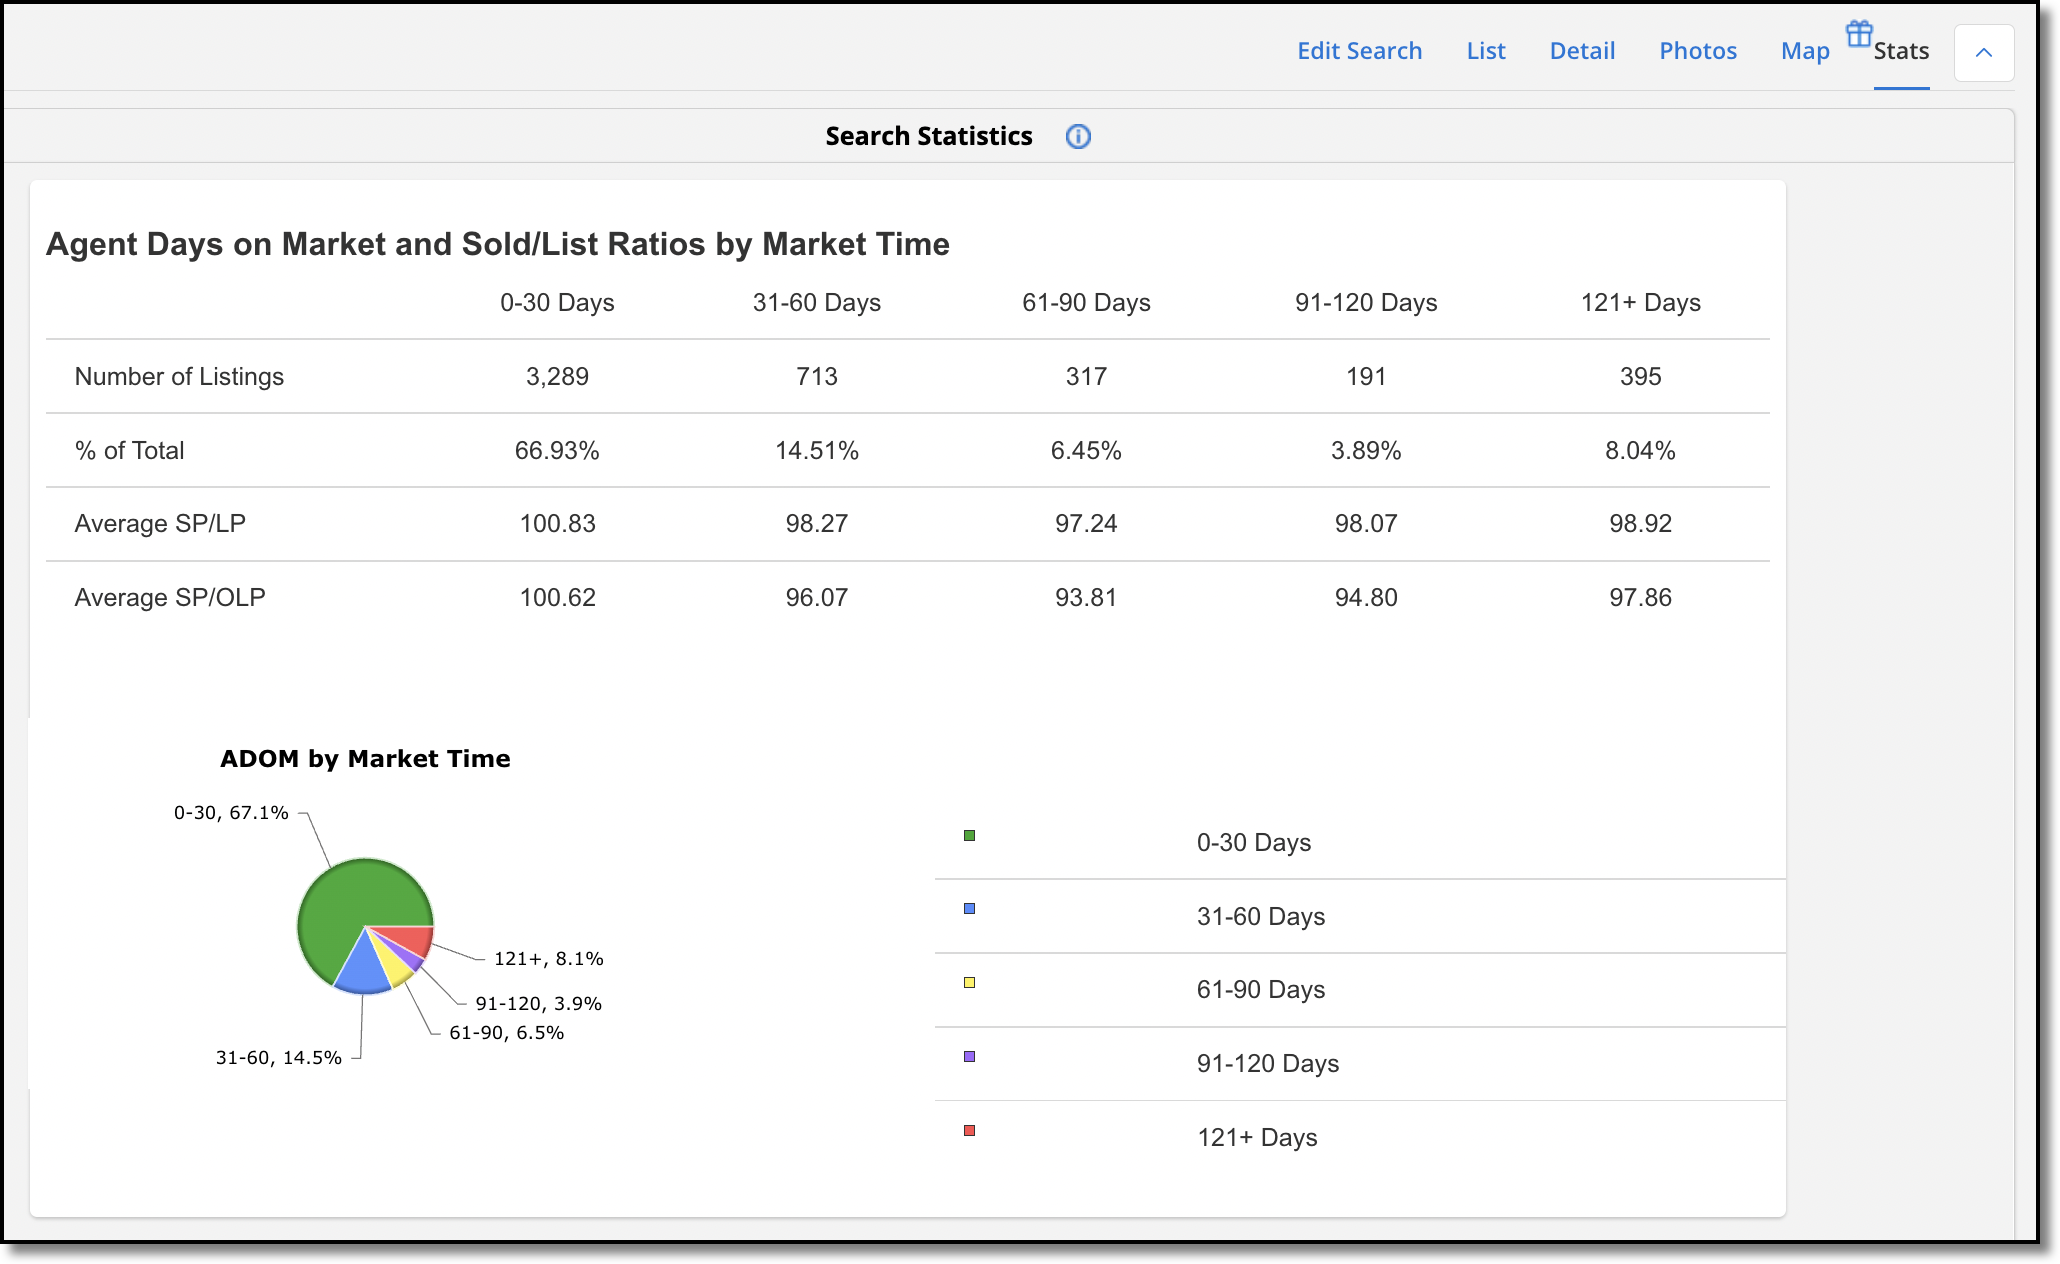
Agent Days on Market and Sold/List Ratios by Market Time - The Agent Days on Market section shows price ratios based on agent days on market, if your MLS uses ADOM. The Number of Listings row categorizes listings from the search results into market time segments (0 to 30 days, 31 to 60 days, etc.). The % of Total row shows the percentage of listings from the current search results in each market time segment. The Average SP/LP row shows the average Sold to List Price ratio for each time segment. The Average SP/OLP shows the average Sold to Original List Price ratio for each time segment.
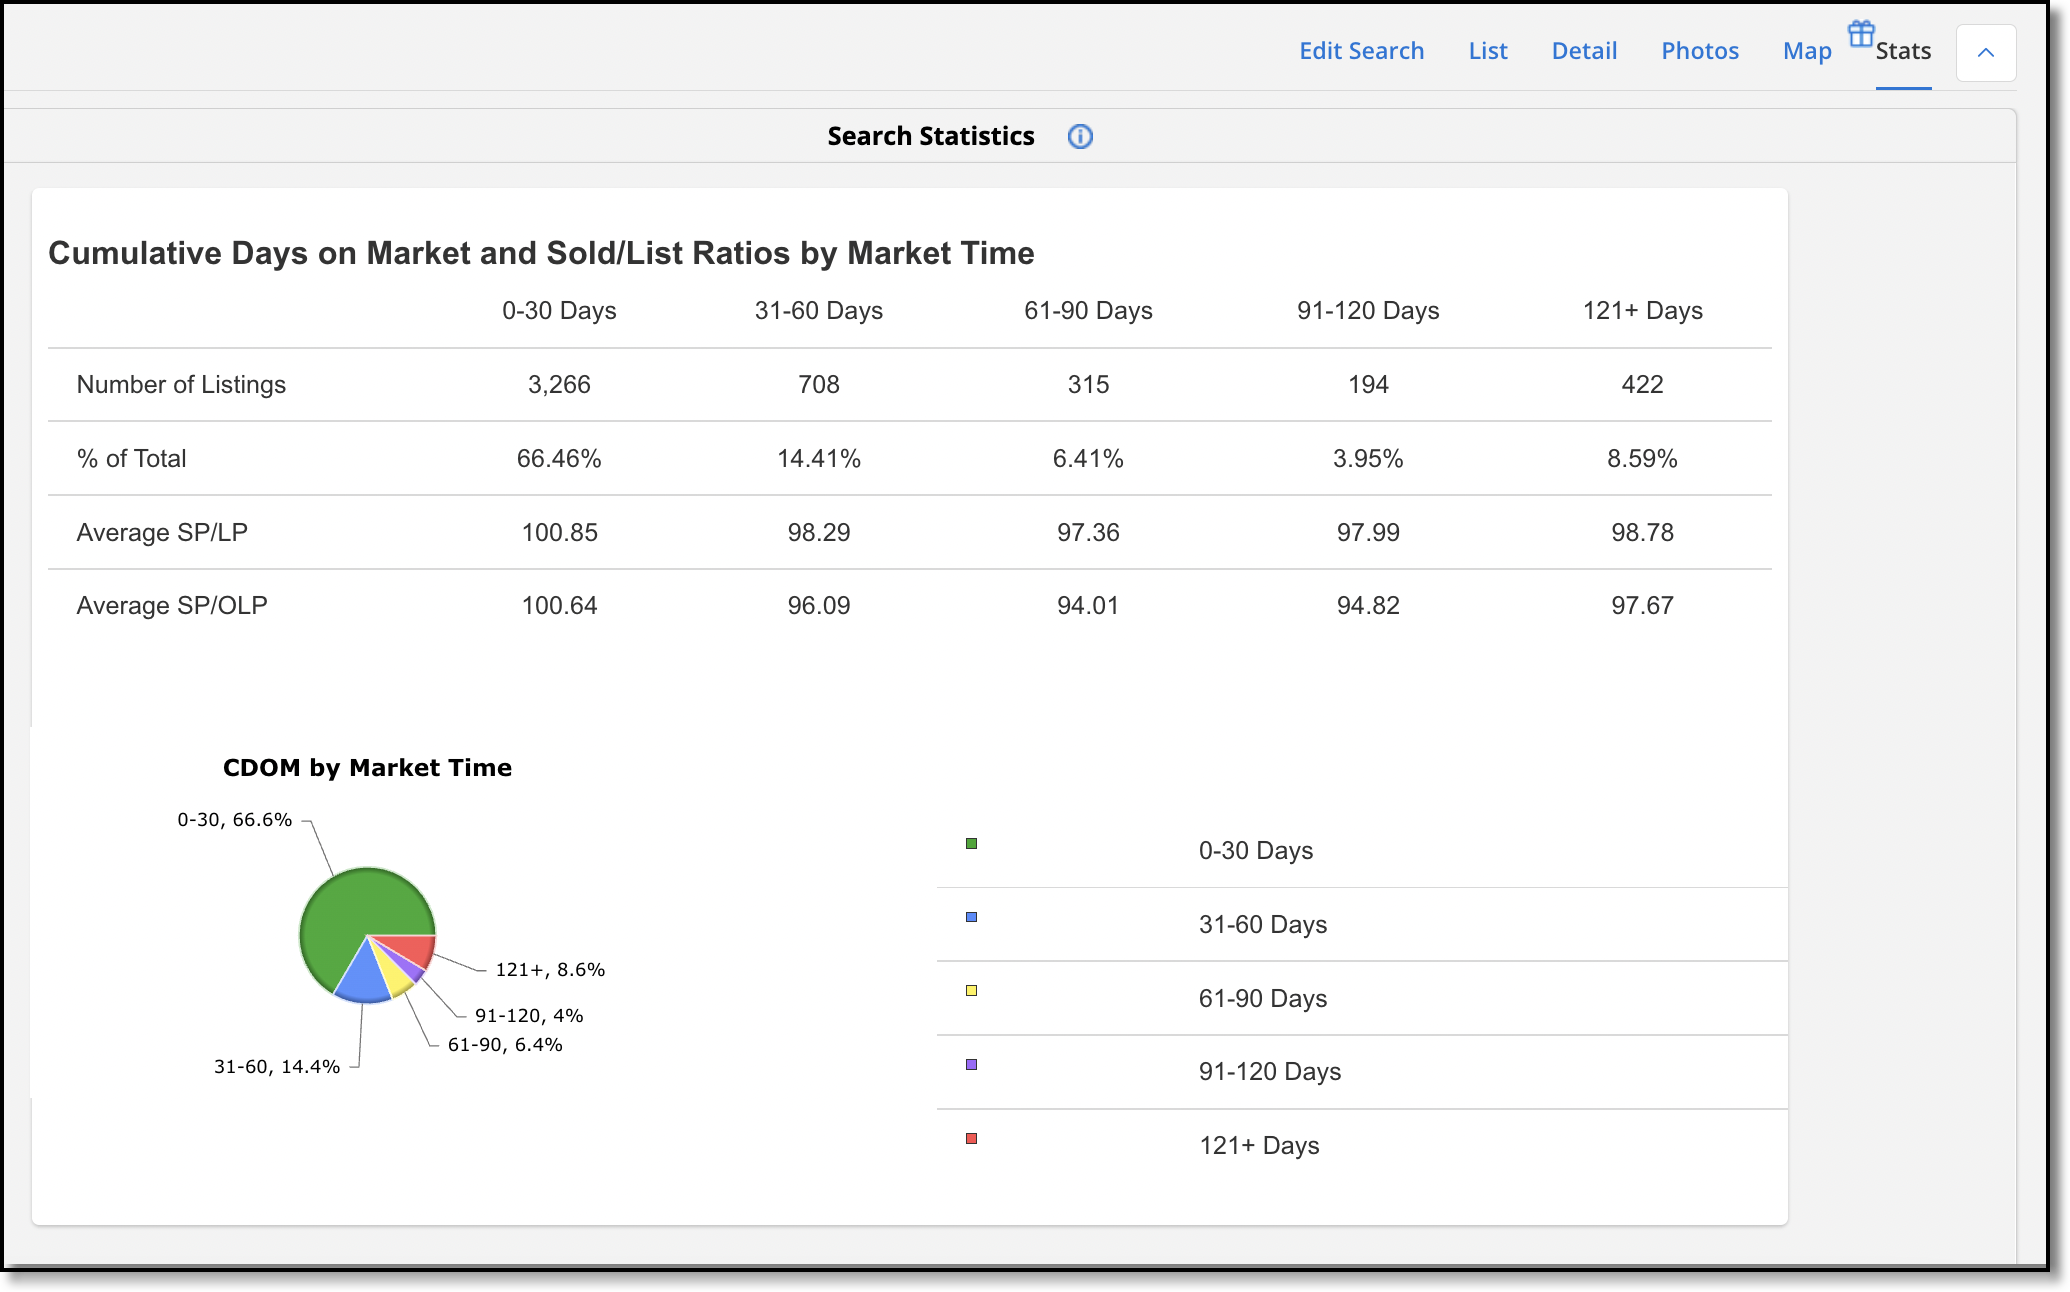
Cumulative Days on Market and Sold/List Ratios by Market Time - The Cumulative Days on Market section shows price ratios based on cumulative days on market, if your MLS uses CDOM. The Number of Listings row categorizes listings from the search results into market time segments (0 to 30 days, 31 to 60 days, etc.). The % of Total row shows the percentage of listings from the current search results in each market time segment. The Average SP/LP row shows the average Sold to List Price ratio for each time segment. The Average SP/OLP shows the average Sold to Original List Price ratio for each time segment.