Launch Activity Reports
MLS admins and Association admins can view and export Launch usage statistics from the Activity Reports tab on the Admin page. This functionality can help to evaluate app usage and improve ability to evaluate ROI on products offered.
To access these reports, click the profile icon in the upper right corner. Select Admin from the dropdown, and navigate to Activity Reports.
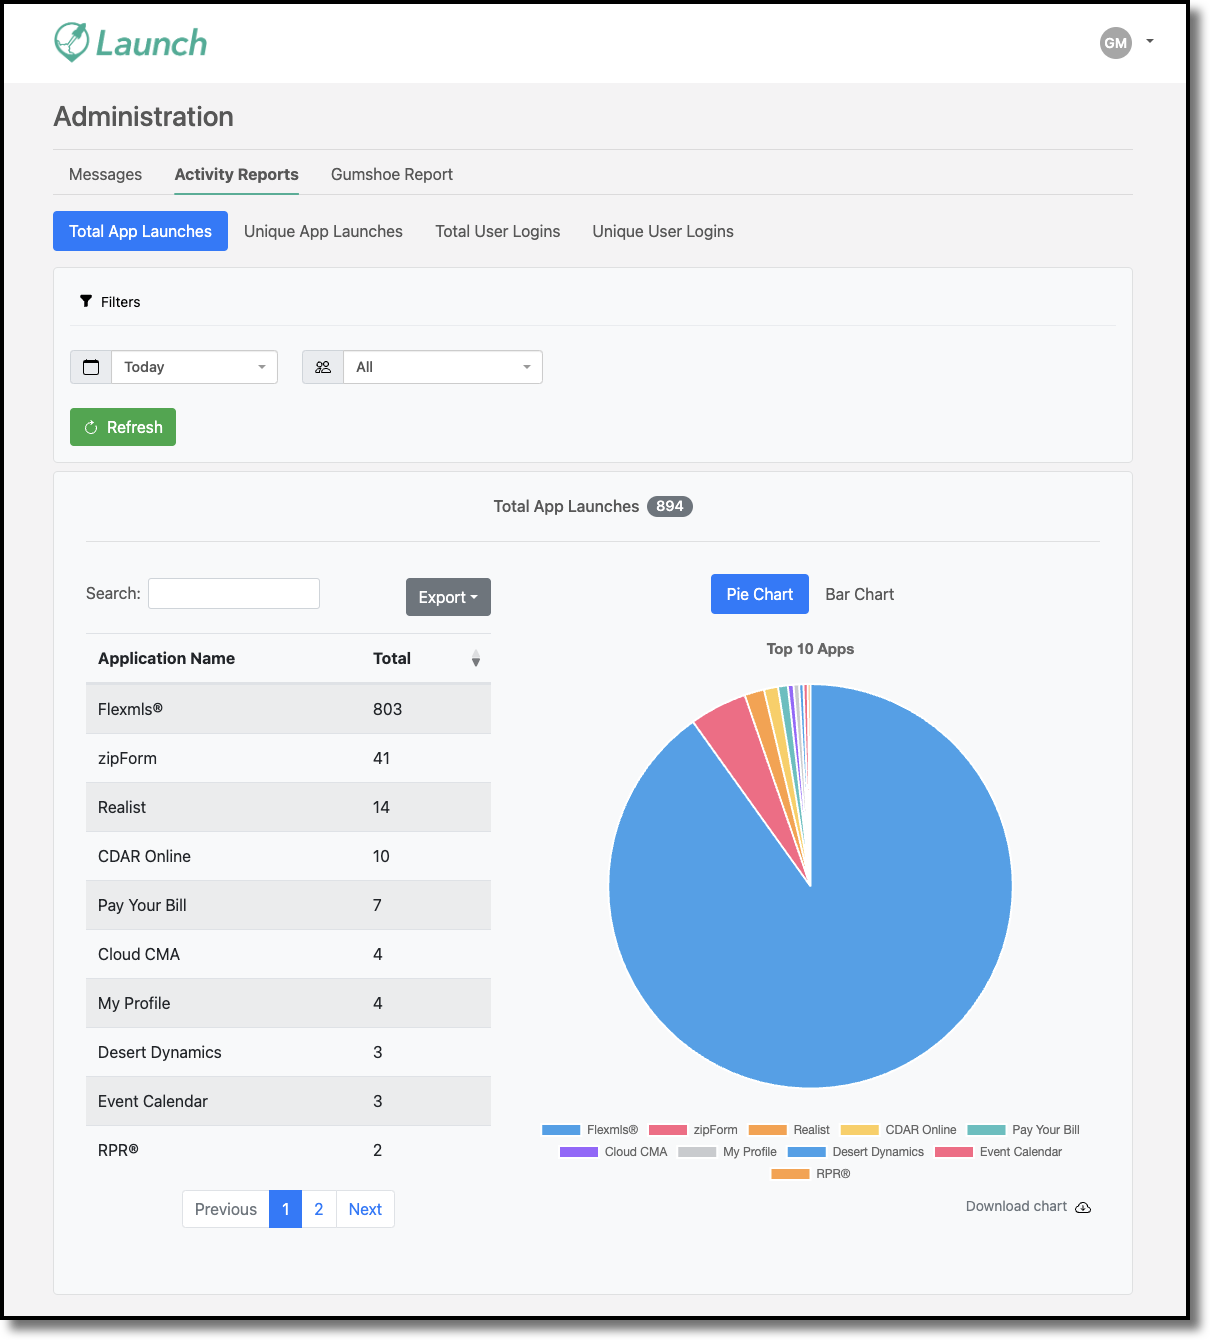
The usage data is broken down into four reports: Total App Launches, Unique App Launches, Total User Logins and Unique User Logins. You can filter the reports by time frame, member type, and association (if your MLS has two or more associations). Timeframe filters include today, last 24 hours, last 7 days, last 30 days, last 90 days, and last one year. To filter the reports, use the dropdown menus to make a selection, and click Refresh.
You can export the data in the activity reports as Excel, CSV, or PDF. You can also download visual charts (pie, bar, and line graphs). These reports measure app access from within the Launch dashboard only.
Note
In the reports, unique refers to each member’s activity being counted just once. For example, if a member has multiple app launches in the selected timeframe, they are counted as just one unique app launch.
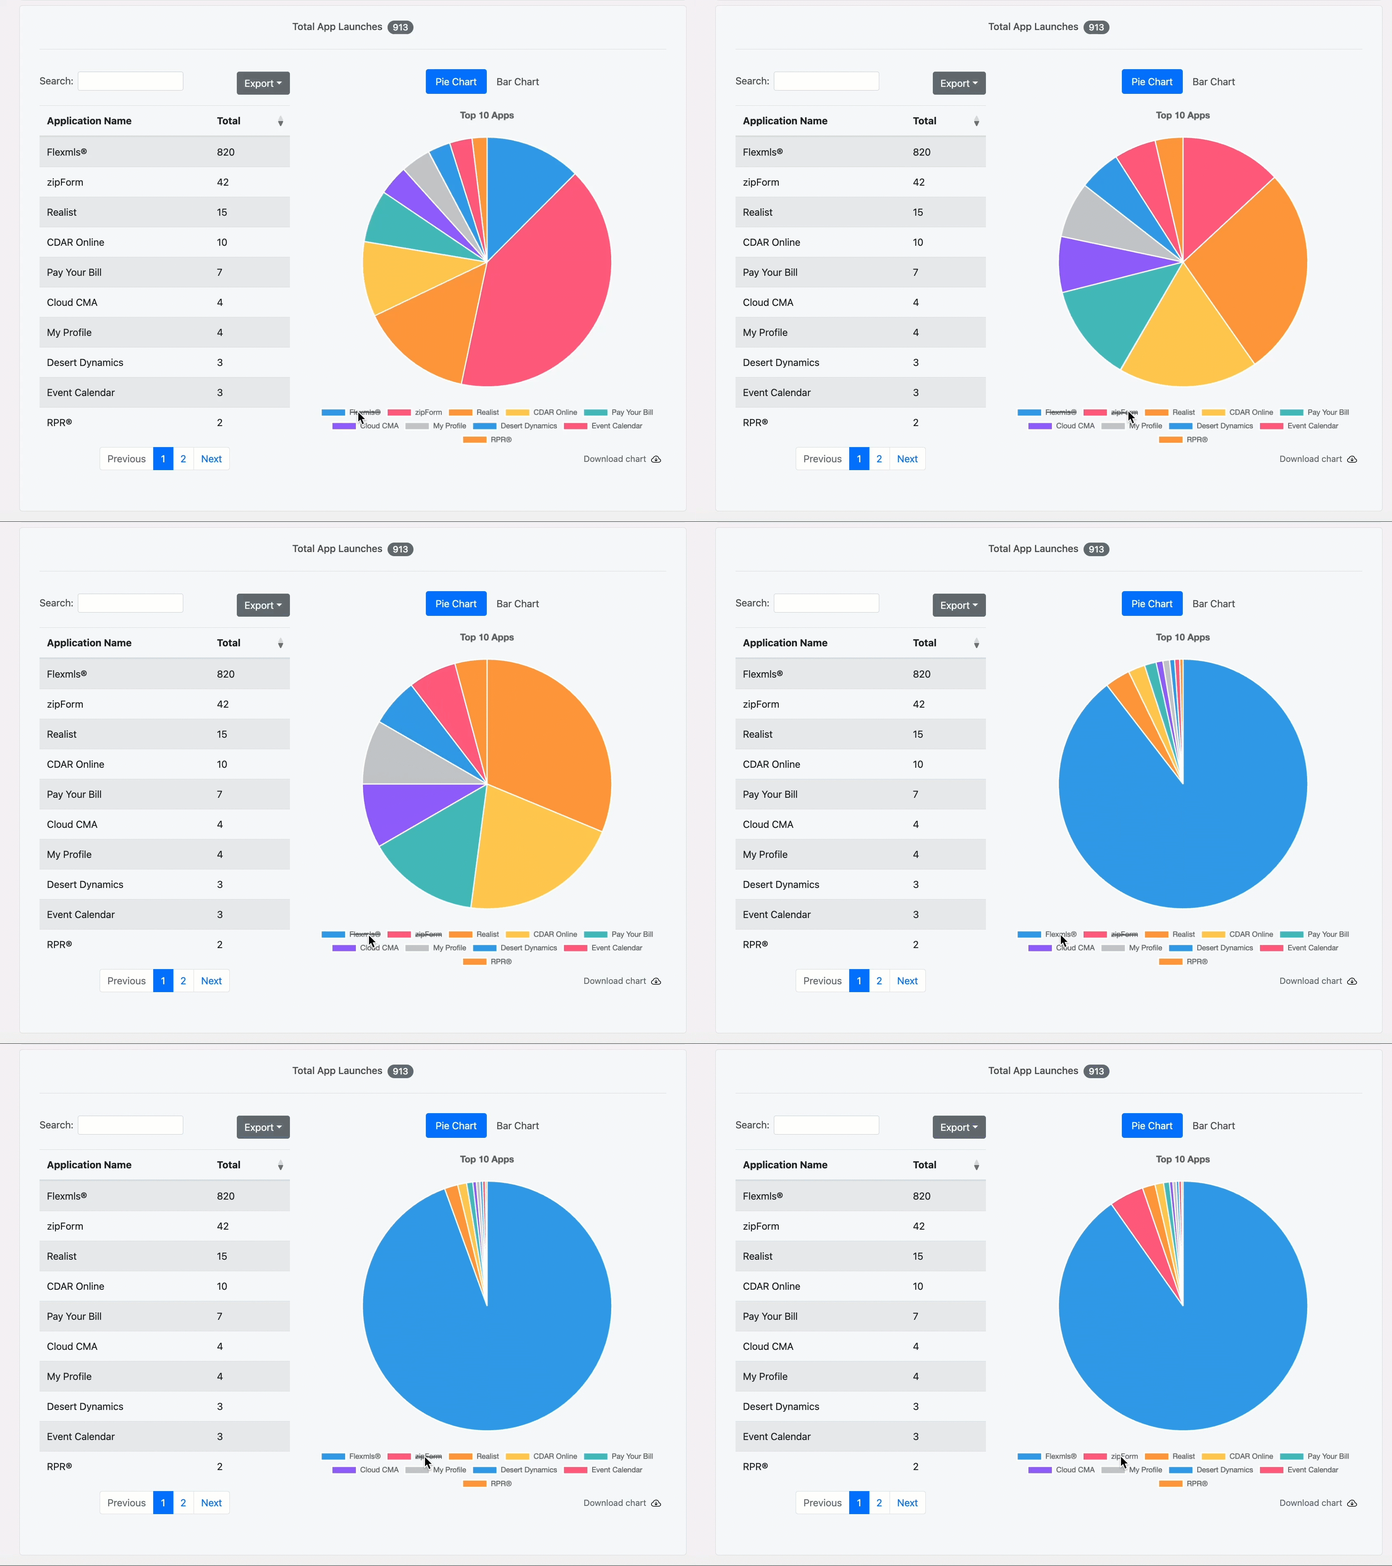
You can click the name of any app in the graph legend to remove it from the analysis for dynamic reporting. Removed apps are marked with a strikethrough. You can click the app name again to restore it to the analysis.