Create a Statistical CMA
A statistical CMA is typically used for buyers. It includes a table of information about comparable properties grouped by listing status or another field that you choose.
Tip
The following Guided Help tours are available for this function in Flexmls. When you click on a link, an instance of Flexmls will open in a new browser tab and instruction bubbles will guide you through the process.
Search for comparable properties in Flexmls. By beginning with a search, you can choose listings based on sold date, price, geographical location, or any other search criteria.
(Optional.) On the search results page, mark the check boxes next to the listings that you want to include.
If you select listings, the statistics in the report will include only the listings that you selected, even if other applicable listings were returned in the search results.
Click the CMA button in the upper right corner of the page. In the pop-up window, click Use All Results. (If you are using only selected listings from the search results, click Use Selected.)
On the CMA Type page, select Statistical CMA and choose a Statistical Average field, if available. Click Next Step at the bottom of the page.
Note
The Statistical Average field is used to add a "Price per” field calculation to the CMA. For example, you may want to base comparison calculations on lot acres in a CMA for land. You may want to base calculations on warehouse square footage in a CMA for a commercial property. (Your MLS determines which fields are available in this list.)
On the Create Statistical CMA page, select the statistics to include.
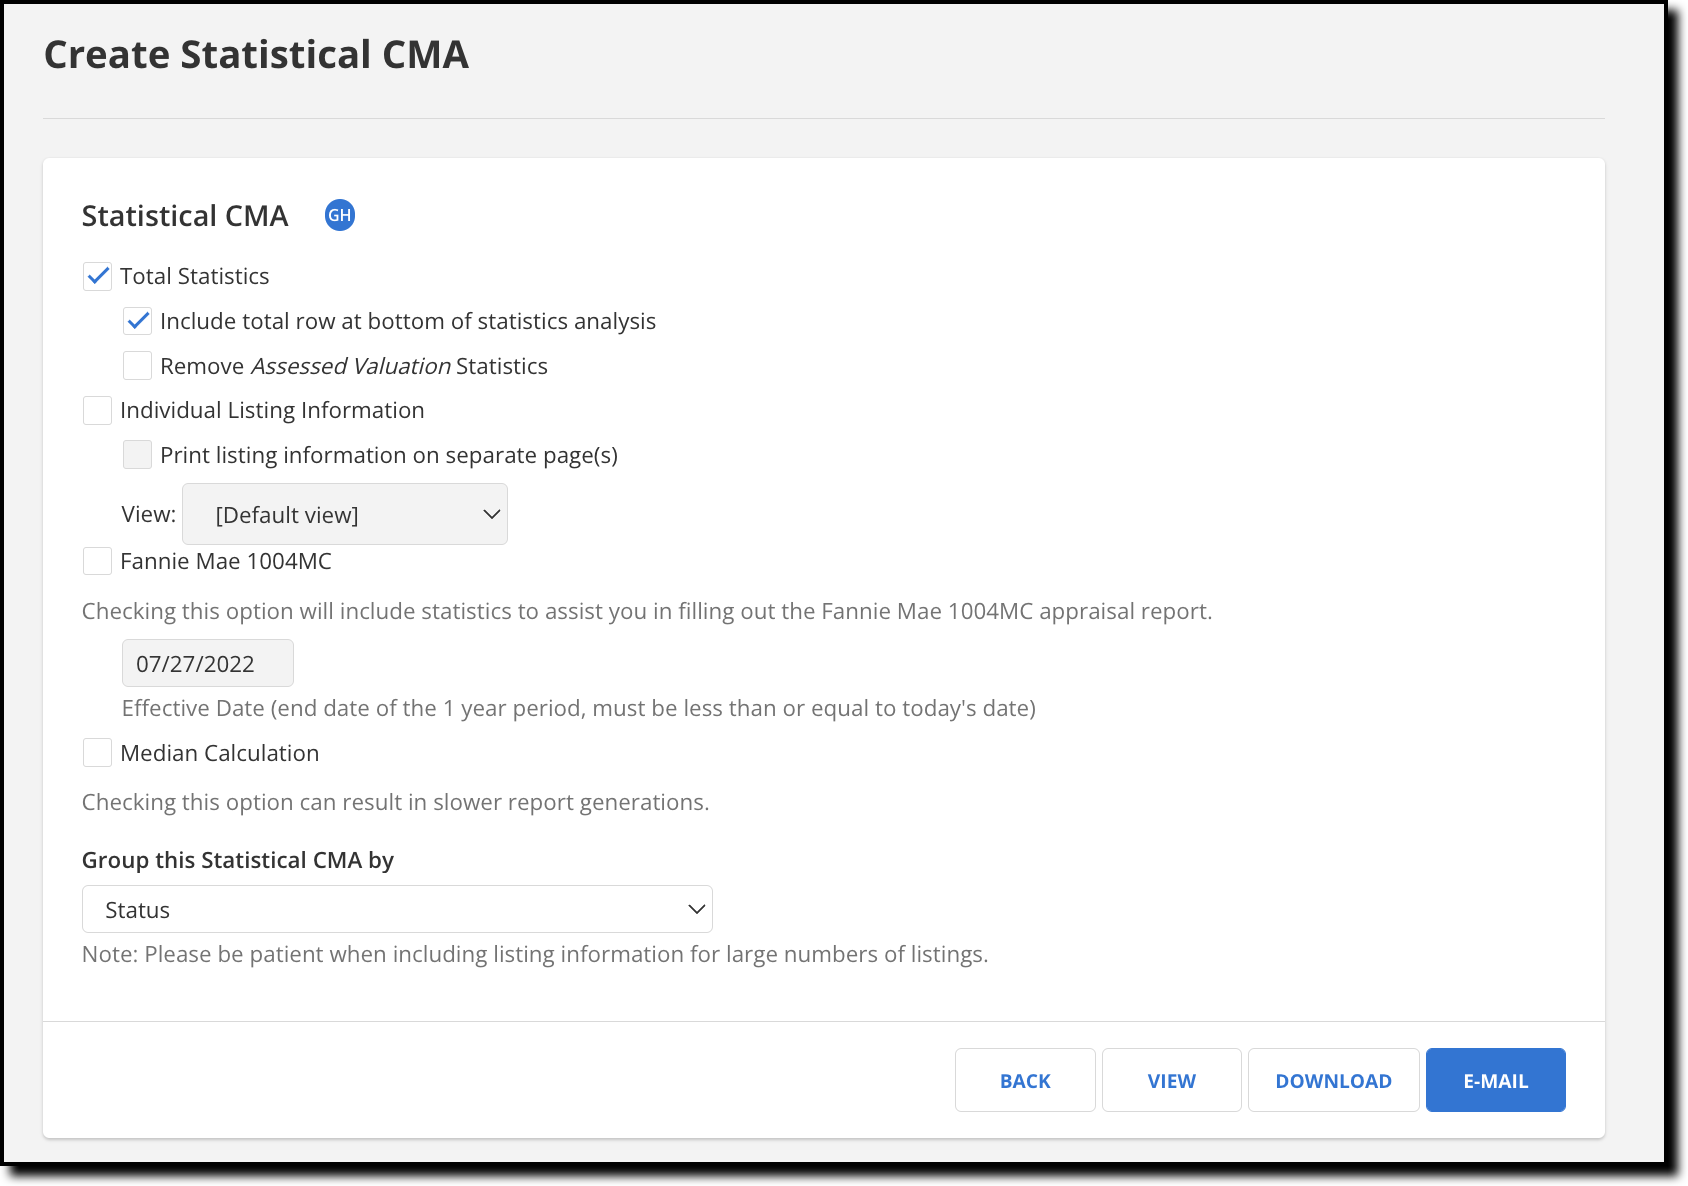
The following options are available:
Option
Description
Total Statistics
This option is selected by default for a statistical CMA. Clear this check box if you are creating a Fannie Mae 1004MC report.
Select Include total row at bottom of statistics analysis to include a row labeled "Overall" that contains grand totals for every column in the CMA.
Select Remove (Statistical Average Field) Statistics to omit the statistics for the Statistical Average field. "Price per" calculations will not be included on the report if this option is selected.
Individual Listing Information
Select this option to display the listings from your search on the CMA.
Select Print listing information on separate page(s) to separate listing information from the Statistical CMA page when printing.
Additionally, select the view to use when displaying listing information. The view determines which columns of data are displayed for listings. For more information about views, see Create or Edit a View.
Fannie Mae 1004MC
This option is not used when creating a statistical CMA. For more information about the report that uses this option, see Create a 1004MC Report.
Median Calculation
Select this option if a median calculation is required for the fields in the report.
If there are an odd number of data values, the median is the value in the middle when the numbers are arranged from least to greatest. For example, in the data set 1, 1, 2, 5, 6, 6, 9, the median is 5.
If there are an even number of data values, the median is the value halfway between the two middle numbers when the numbers are arranged from least to greatest. For example, in the data set 1, 1, 2, 6, 6, 9, the median is 4.
Note
Selecting this option can increase the time it takes to generate the report.
Group this Statistical CMA by
Select how you would like to group the CMA. If, for example, you select Status, the CMA will group statistics by current listing status.
To save the CMA and make it available on the Saved CMAs page, click Save. To email the CMA, click the Email button to open the Flexmls email dialog. To preview the CMA on a web page, click the View button. Click Download to create and download a PDF version of the CMA.
The result will look similar to the example below, depending on the selections you've made.
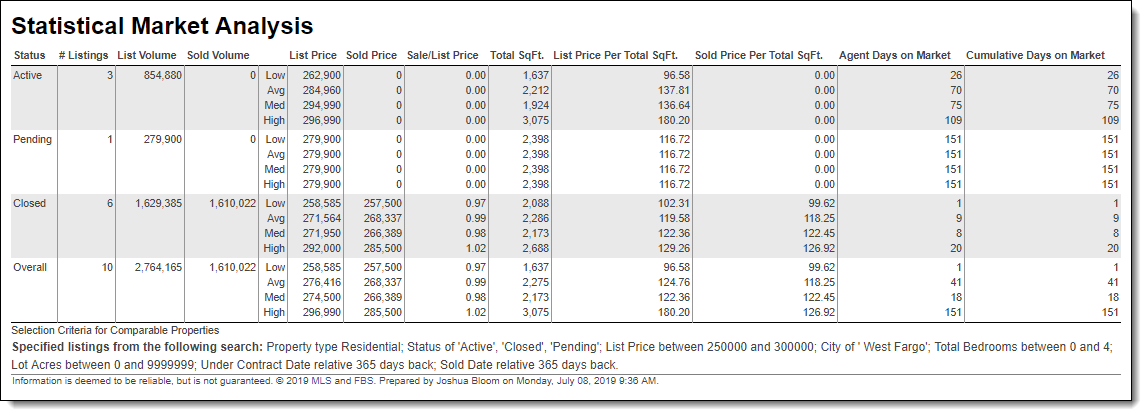
The rows in the statistical CMA are calculated using the listings you selected. Each column is calculated independently from the other columns. In other words, the listing that provides the Low List Price may not be the same listing that provides the Low Days on Market figure.
The low, high, median, and average values for statistical average field columns are calculated independently, as well. For example, the sold price per square foot will be calculated for each listing, and then the low, high, median, and average values are determined based on that data set. These values are not calculated based on low, high, median, or average values from other columns.
Statistic | Definition |
|---|---|
Group by | The field used to group the statistics, as specified using the Group this Statistical CMA by option. For example, if Status was selected, the results will be grouped by Status. |
# Listings | The number of listings from the search results in each group. The total number of listings is displayed at the bottom of the column, if the option Include total row at bottom of statistics analysis was selected. |
List Volume | The sum of the last known List Price for the listings in each group. At the bottom of the column, the Overall row shows the sum of the list prices for all the listings. |
Sold Volume | The sum of the last known Sold Price for the listings with sold/closed status. |
Sale/List Price | The ratio of Sold Price to List Price. This ratio is calculated across all applicable sold listings used in the CMA and provides a figure for Low, Avg, Med, and High rows. To calculate these ratios, the Sold Price is divided by the List Price for each sold/closed status listing. The Avg and Med rows are calculated based on individual Sale to List Price ratios for all the sold/closed listings. |
Low/High | The Low and High rows display the lowest and highest figures in the group. No calculations are used. |
Average/Median | If Median Calculation was selected, the Average and Median rows are calculated for the listings in each group. |