Dashboard Gadgets: Statistics

The following gadgets are listed under Statistics in the Add Gadgets page:
Absorption Rate
Prices
Sold DOM
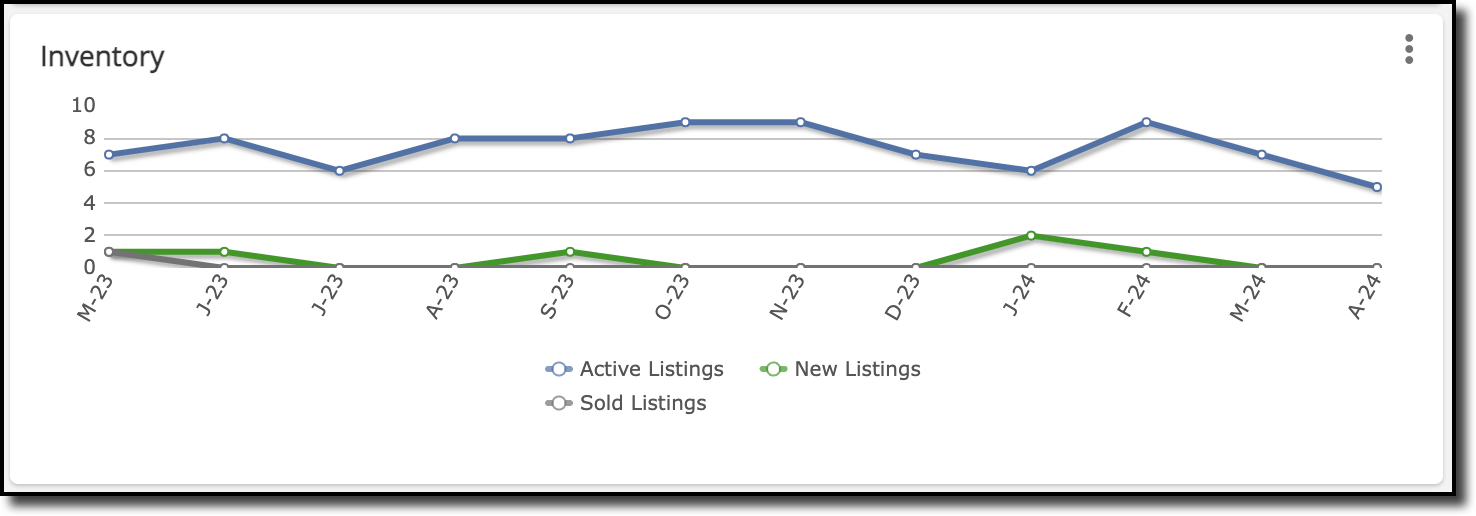
Inventory
Sale to Original List Price Ratio
Volume
Each of these gadgets displays a graph representing the corresponding information. For example, the Absorption Rate gadget displays a graph representing the absorption rate in months. You can configure these gadgets by clicking the three dots at the top right corner of the gadget and selecting Settings from the dropdown menu. Under Settings, you can set the Location, Property Types, and Display. To configure these gadgets to get the singular location that you want, you can either enter a location in the text box or select a location from the menu in the pop-up window. You can also select from any map overlays you have created. After you have finished making your modifications in Settings, click Save to apply the changes.
Click Refresh to refresh the gadget and display any updates. Click Maximize to view this gadget in fullscreen mode. Click the three dots and then click Restore to restore the gadget back to its original size. Click Remove to remove the gadget from your dashboard.
Each of the statistics gadgets reflects the same information displayed in the Market Summary report, which you can run by going to Menu > Statistics > Market Summary. For more information on how to configure the Market Summary report, visit the Market Summary Report Help.